ECS and Fargate monitoring with CloudWatch metrics, alarms, and EventBridge
Andreas Wittig – 14 Nov 2026
Amazon ECS is good at hiding problems. A container crashes, the service scheduler starts a new task, that one crashes too, and the loop continues quietly in the background. A deployment never finishes because the new tasks fail their health checks. A service on Fargate Spot loses its only task and waits for capacity. In all of these cases, the ECS console shows the details to whoever happens to look, but nobody gets an alert, and your customers notice before you do.

This blog post teaches you how to monitor Amazon ECS services running on AWS Fargate or Amazon EC2. You will learn which CloudWatch metrics matter, which alarms we recommend, which EventBridge events you should never miss, and how to set it all up with CloudFormation. At the end, you will receive ECS alerts in Slack or Microsoft Teams.
What can go wrong with ECS and Fargate
Containers on ECS fail in ways a CPU graph doesn’t show. These are the failures we see most often:
- Tasks fail to start. A missing image, a wrong IAM role, or an unreachable secret stops the task before your code runs.
- An essential container exits. The application crashes, ECS stops the task, and the service starts a new one, again and again.
- A deployment fails. The new task definition never reaches a steady state, and the service is stuck between two versions or rolls back.
- Tasks can’t be placed. On EC2, the cluster runs out of CPU or memory. On Fargate Spot, there is no spare capacity.
- The service runs out of resources. Memory runs full and the container is killed, or CPU is saturated and requests time out.
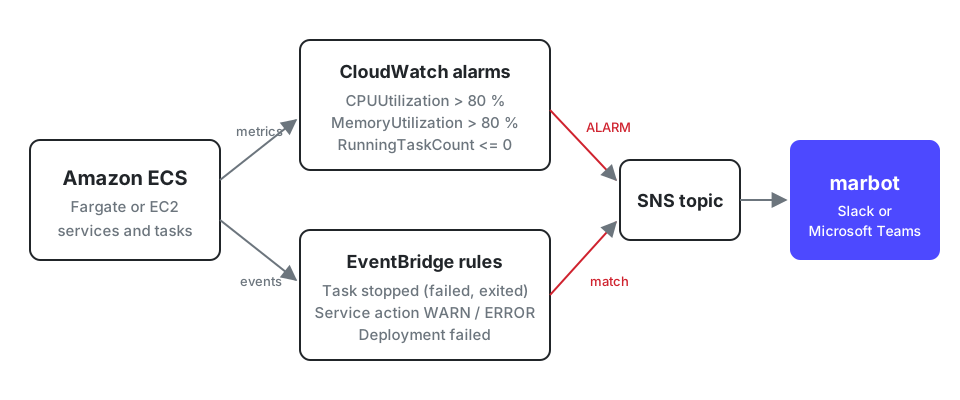
Some of these failures show up in metrics, others only as events. That’s why a complete ECS monitoring setup combines CloudWatch alarms and EventBridge rules.
CloudWatch metrics for ECS services
Out of the box, ECS sends the following metrics to the AWS/ECS namespace at one-minute intervals, for free:
CPUUtilizationandMemoryUtilizationwith the dimensionsClusterNameandServiceName: the CPU and memory in use by the service’s tasks, as a percentage of what the tasks reserved. These service-level metrics are available for Fargate and EC2.CPUReservationandMemoryReservationwith the dimensionClusterName: how much of the cluster’s EC2 capacity is reserved by tasks. These metrics only exist for tasks hosted on EC2 instances.
There is a catch: ECS only reports metrics for resources with tasks in the RUNNING state. A service that dropped to zero tasks stops sending data, and an alarm on CPUUtilization won’t notice.
That’s where Container Insights comes in. Once enabled for a cluster, it publishes additional metrics to the ECS/ContainerInsights namespace, among them:
RunningTaskCount,PendingTaskCount, andDesiredTaskCountper service.EphemeralStorageUtilizedandEphemeralStorageReservedfor tasks on Fargate (Linux platform version 1.4.0 or later).RestartCountfor containers with a restart policy.
Container Insights isn’t free, so check CloudWatch pricing before you turn it on for many clusters. For production services, the running task count alone is worth it.
Recommended CloudWatch alarms
We recommend the following alarms per ECS service. The thresholds follow the AWS recommended alarms: every alarm uses a period of 60 seconds and fires after 5 out of 5 datapoints breach the threshold.
| Metric | Namespace | Statistic | Threshold | Why |
|---|---|---|---|---|
CPUUtilization |
AWS/ECS |
Average | > 80 % | Requests slow down before CPU hits 100 %. Scale out or increase the task size. |
MemoryUtilization |
AWS/ECS |
Average | > 80 % | A container that exceeds its memory limit is killed. |
RunningTaskCount |
ECS/ContainerInsights |
Average | <= 0 | The service is down. Raise the threshold to your minimum task count. |
EphemeralStorageUtilized |
ECS/ContainerInsights |
Average | > 90 % of reserved | A full disk breaks logs, uploads, and temp files on Fargate. |
CPUReservation |
AWS/ECS |
Average | > 80 % | EC2 only: new tasks won't fit into the cluster soon. |
MemoryReservation |
AWS/ECS |
Average | > 80 % | EC2 only: same as above, for memory. |
Set treat missing data to breaching for the RunningTaskCount alarm. Without data, the safest assumption is that no task is running.
If your service sits behind an Application Load Balancer, add alarms for the target group as well, for example on HTTPCode_Target_5XX_Count and TargetResponseTime. Read Monitoring: Application Load Balancer to learn which ALB alarms marbot creates. To reduce the number of alarms and their costs, check out how to combine metrics with metric math.
EventBridge events you should never miss
Metrics can’t tell you why a task stopped or that a deployment failed. ECS sends events to Amazon EventBridge for that. These are the ones worth an alert:
| Detail type | Filter | What happened |
|---|---|---|
ECS Task State Change |
lastStatus = STOPPED, stopCode = TaskFailedToStart |
A task failed to start. |
ECS Task State Change |
lastStatus = STOPPED, stopCode = EssentialContainerExited |
An essential container exited, and ECS stopped the task. |
ECS Task State Change |
stopCode = SpotInterruption |
Fargate Spot interrupts the task in two minutes. |
ECS Service Action |
eventType = WARN or ERROR |
For example SERVICE_TASK_START_IMPAIRED or SERVICE_TASK_PLACEMENT_FAILURE. |
ECS Deployment State Change |
eventName = SERVICE_DEPLOYMENT_FAILED |
A deployment failed. |
Two details are easy to overlook:
SERVICE_DEPLOYMENT_FAILEDis only sent for services with the deployment circuit breaker turned on. Without it, a broken deployment keeps retrying and never fails. Turn it on, ideally with rollback.SERVICE_TASK_PLACEMENT_FAILUREincludes areasonsuch asRESOURCE:CPUorRESOURCE:FARGATE, which tells you whether the cluster is full or Fargate Spot has no capacity.
Set it up with CloudFormation
The following template enables Container Insights for a new cluster, creates the RunningTaskCount alarm, and creates EventBridge rules for the events above. All alerts go to an existing SNS topic. The topic’s access policy must allow events.amazonaws.com to publish to it, or EventBridge can’t deliver the events.
AWSTemplateFormatVersion: '2010-09-09' |
To make sure the deployment rule ever fires, turn on the deployment circuit breaker in your AWS::ECS::Service:
DeploymentConfiguration: |
Add the CPUUtilization and MemoryUtilization alarms from the table the same way, with the namespace AWS/ECS and the comparison operator GreaterThanThreshold.
Send ECS alerts to Slack or Microsoft Teams
E-mails from SNS are easy to ignore, and the raw event JSON doesn’t tell you what to do next. marbot delivers ECS alerts to the channel where your team already works, and makes sure somebody acknowledges each one.
The Monitoring Assistant creates the EventBridge rules for ECS for you. You get alerted when a task fails to start, when an essential container of a standalone task exits with a non-zero exit code, when a service fails, and when a deployment fails or succeeds. See Monitoring: Amazon ECS for the details. For Fargate Spot, marbot notifies you about interruptions as well.
Monitoring Assistant
Tired of writing EventBridge patterns? Ask marbot to monitor your ECS services and receive alerts in Slack or Microsoft Teams!It couldn't be easier!
- Add marbot to Slack or Microsoft Teams.
- Invite marbot to a channel.
- Follow the setup wizard.
Want to dig deeper into monitoring containers on AWS? I’ve written about the five priorities for monitoring container workloads on cloudonaut.io. Do you have any questions? Please send a message to hello@marbot.io.
Take your AWS monitoring to a new level! Chatbot for AWS Monitoring: Configure monitoring, escalate alerts, solve incidents.