Reduce CloudWatch alarms by combining metrics to reduce costs or improve auto scaling
Andreas Wittig – 17 Dec 2019
Every part of your AWS infrastructure emits utilization metrics. Amazon CloudWatch collects these metrics and allows you to visualize them as well as to define alarms. AWS announced an exciting new feature allowing you to combine multiple metrics recently: IF/AND/OR statements for metric math.

Combining CloudWatch metrics has several advantages:
- Simplify your monitoring configuration by reducing the number of CloudWatch alarms.
- Reduce costs by reducing the number of CloudWatch alarms (each alarm costs around USD 0.10 per month).
- Increase or decrease the desired capacity of an Auto Scaling Group according to multiple metrics (e.g., the typical bottlenecks CPU, memory, and network).
All you need to do is to define a Metric Math Expression that combines multiple metrics. Doing so results in a calculated metric. Next, you can define a CloudWatch alarm or a visualization based on the calculated metric.
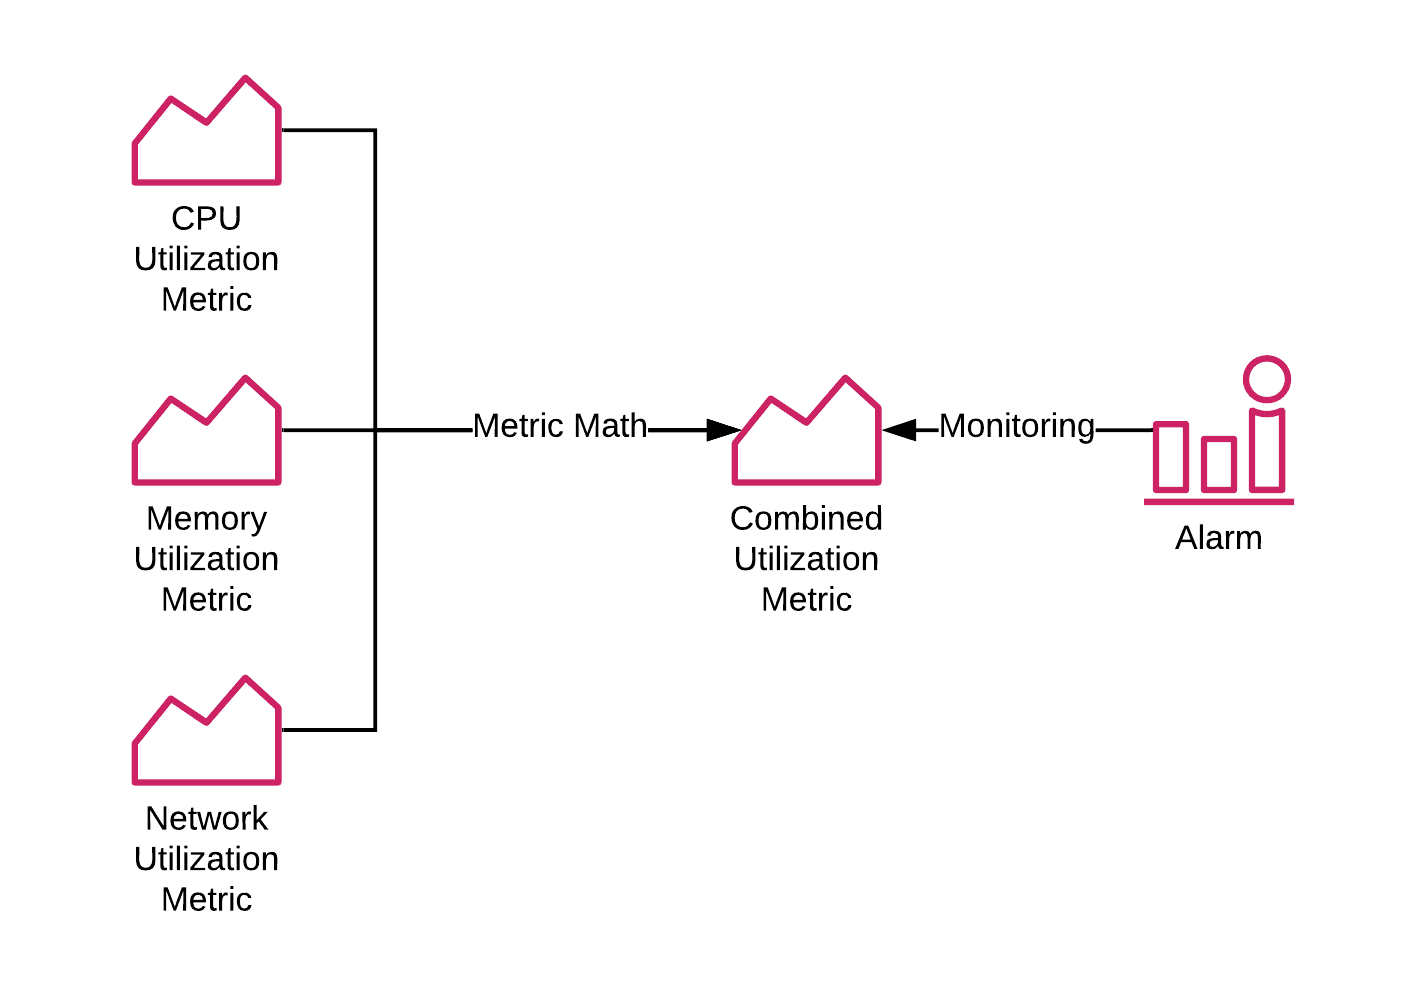
Let’s imagine the following scenario: you are using an Auto Scaling Group to launch EC2 instances. Typical bottlenecks of your virtual machines are:
- CPU
- Memory
- Network (see EC2 Network Benchmark)
Monitoring Assistant
Monitor EC2 instances and receive alerts in Slack or Microsoft Teams!It couldn't be easier!
- Add marbot to Slack or Microsoft Teams.
- Invite marbot to a channel.
- Follow the setup wizard.
How do you get notified or scale-out automatically when one of these resources gets scarce? And how do you get notified or scale in automatically when the resources are no longer being used?
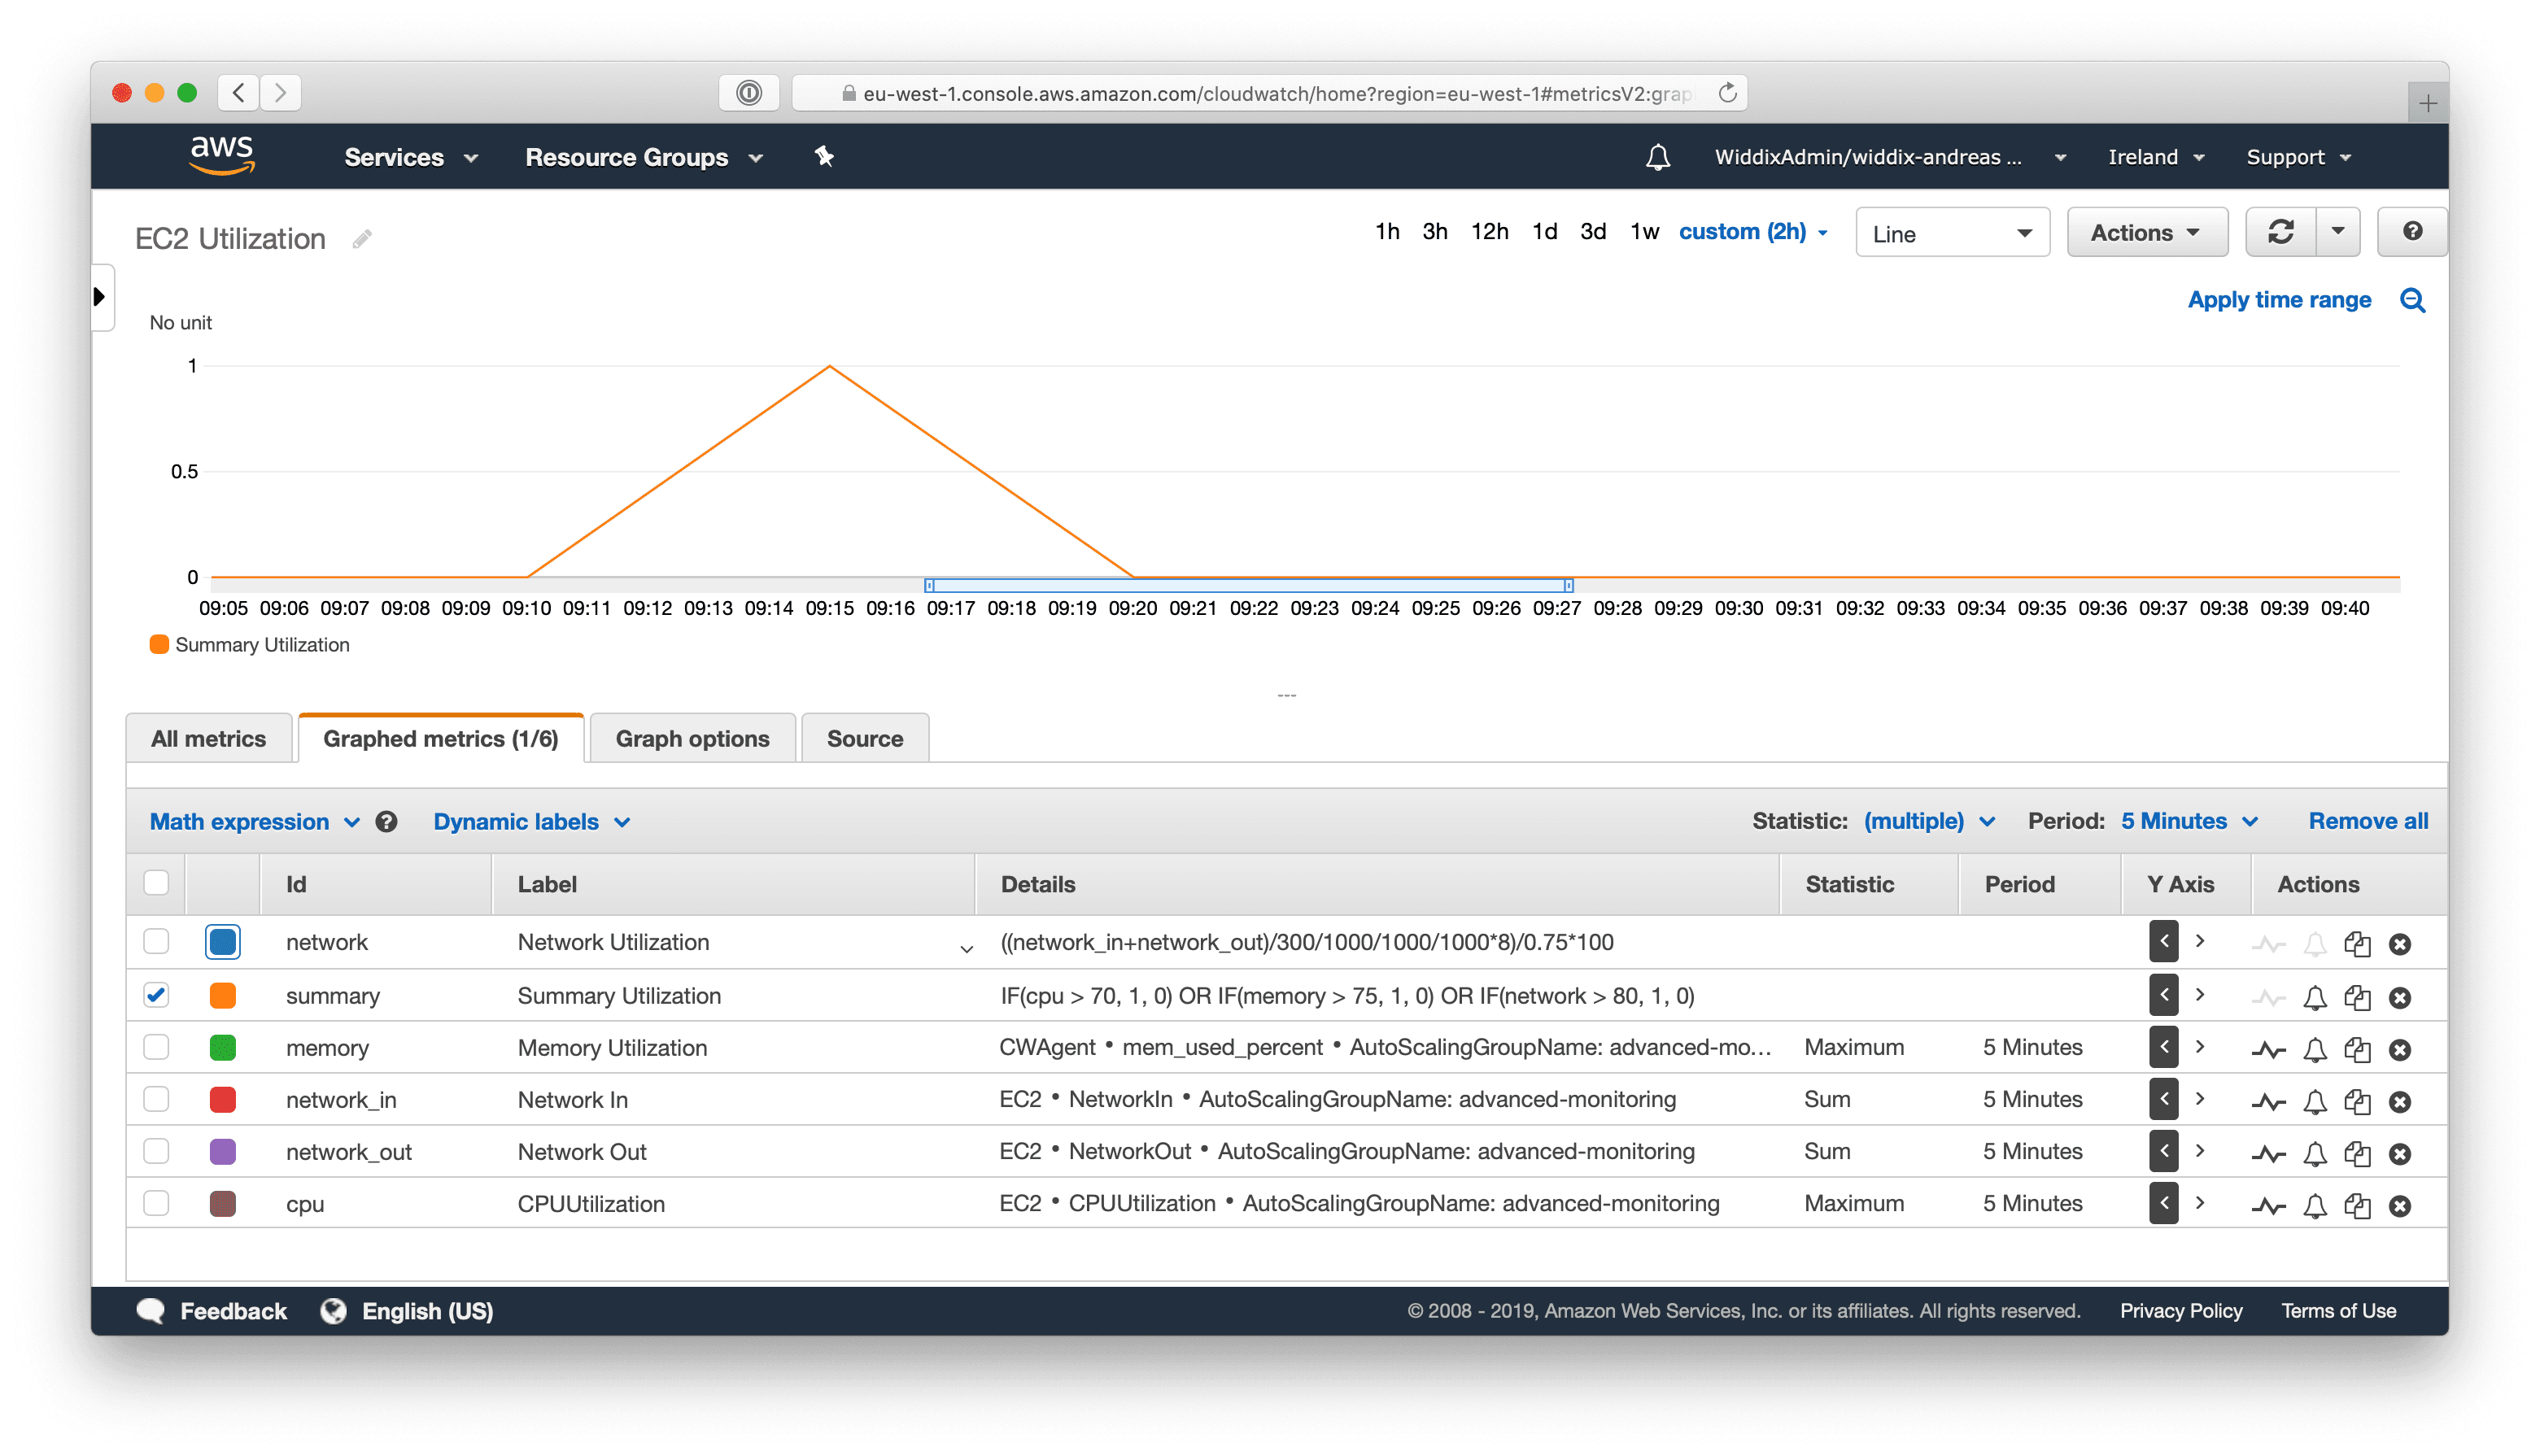
The following screenshot shows four basic metrics:
- CPU Utilization
- Memory Utilization
- Network In
- Network Out
Please note that AWS does not provide a memory utilization metric by default. Therefore, I’m using the CloudWatch Agent to collect the data for a memory utilization metric.
Also, as explained in Monitoring EC2 Network Utilization, you need to combine the Network In and Network Out metric to calculate the total network throughput. The Network Utilization metric calculates the percentage utilization of the network.
However, I want to put your attention on the Summary Utilization metric:
IF(cpu > 70, 1, 0) OR IF(memory > 75, 1, 0) OR IF(network > 80, 1, 0) |
- If the CPU utilization is above 70%, the metric math expression will return
1. - If the memory utilization is above 75%, the metric math expression will return
1. - If the network utilization is above 80%, the metric math expression will return
1. - Otherwise, the metric math expression will return
0.
Next, define a CloudWatch alarm based on the Summary Utilization metric. Use 1 for the threshold.
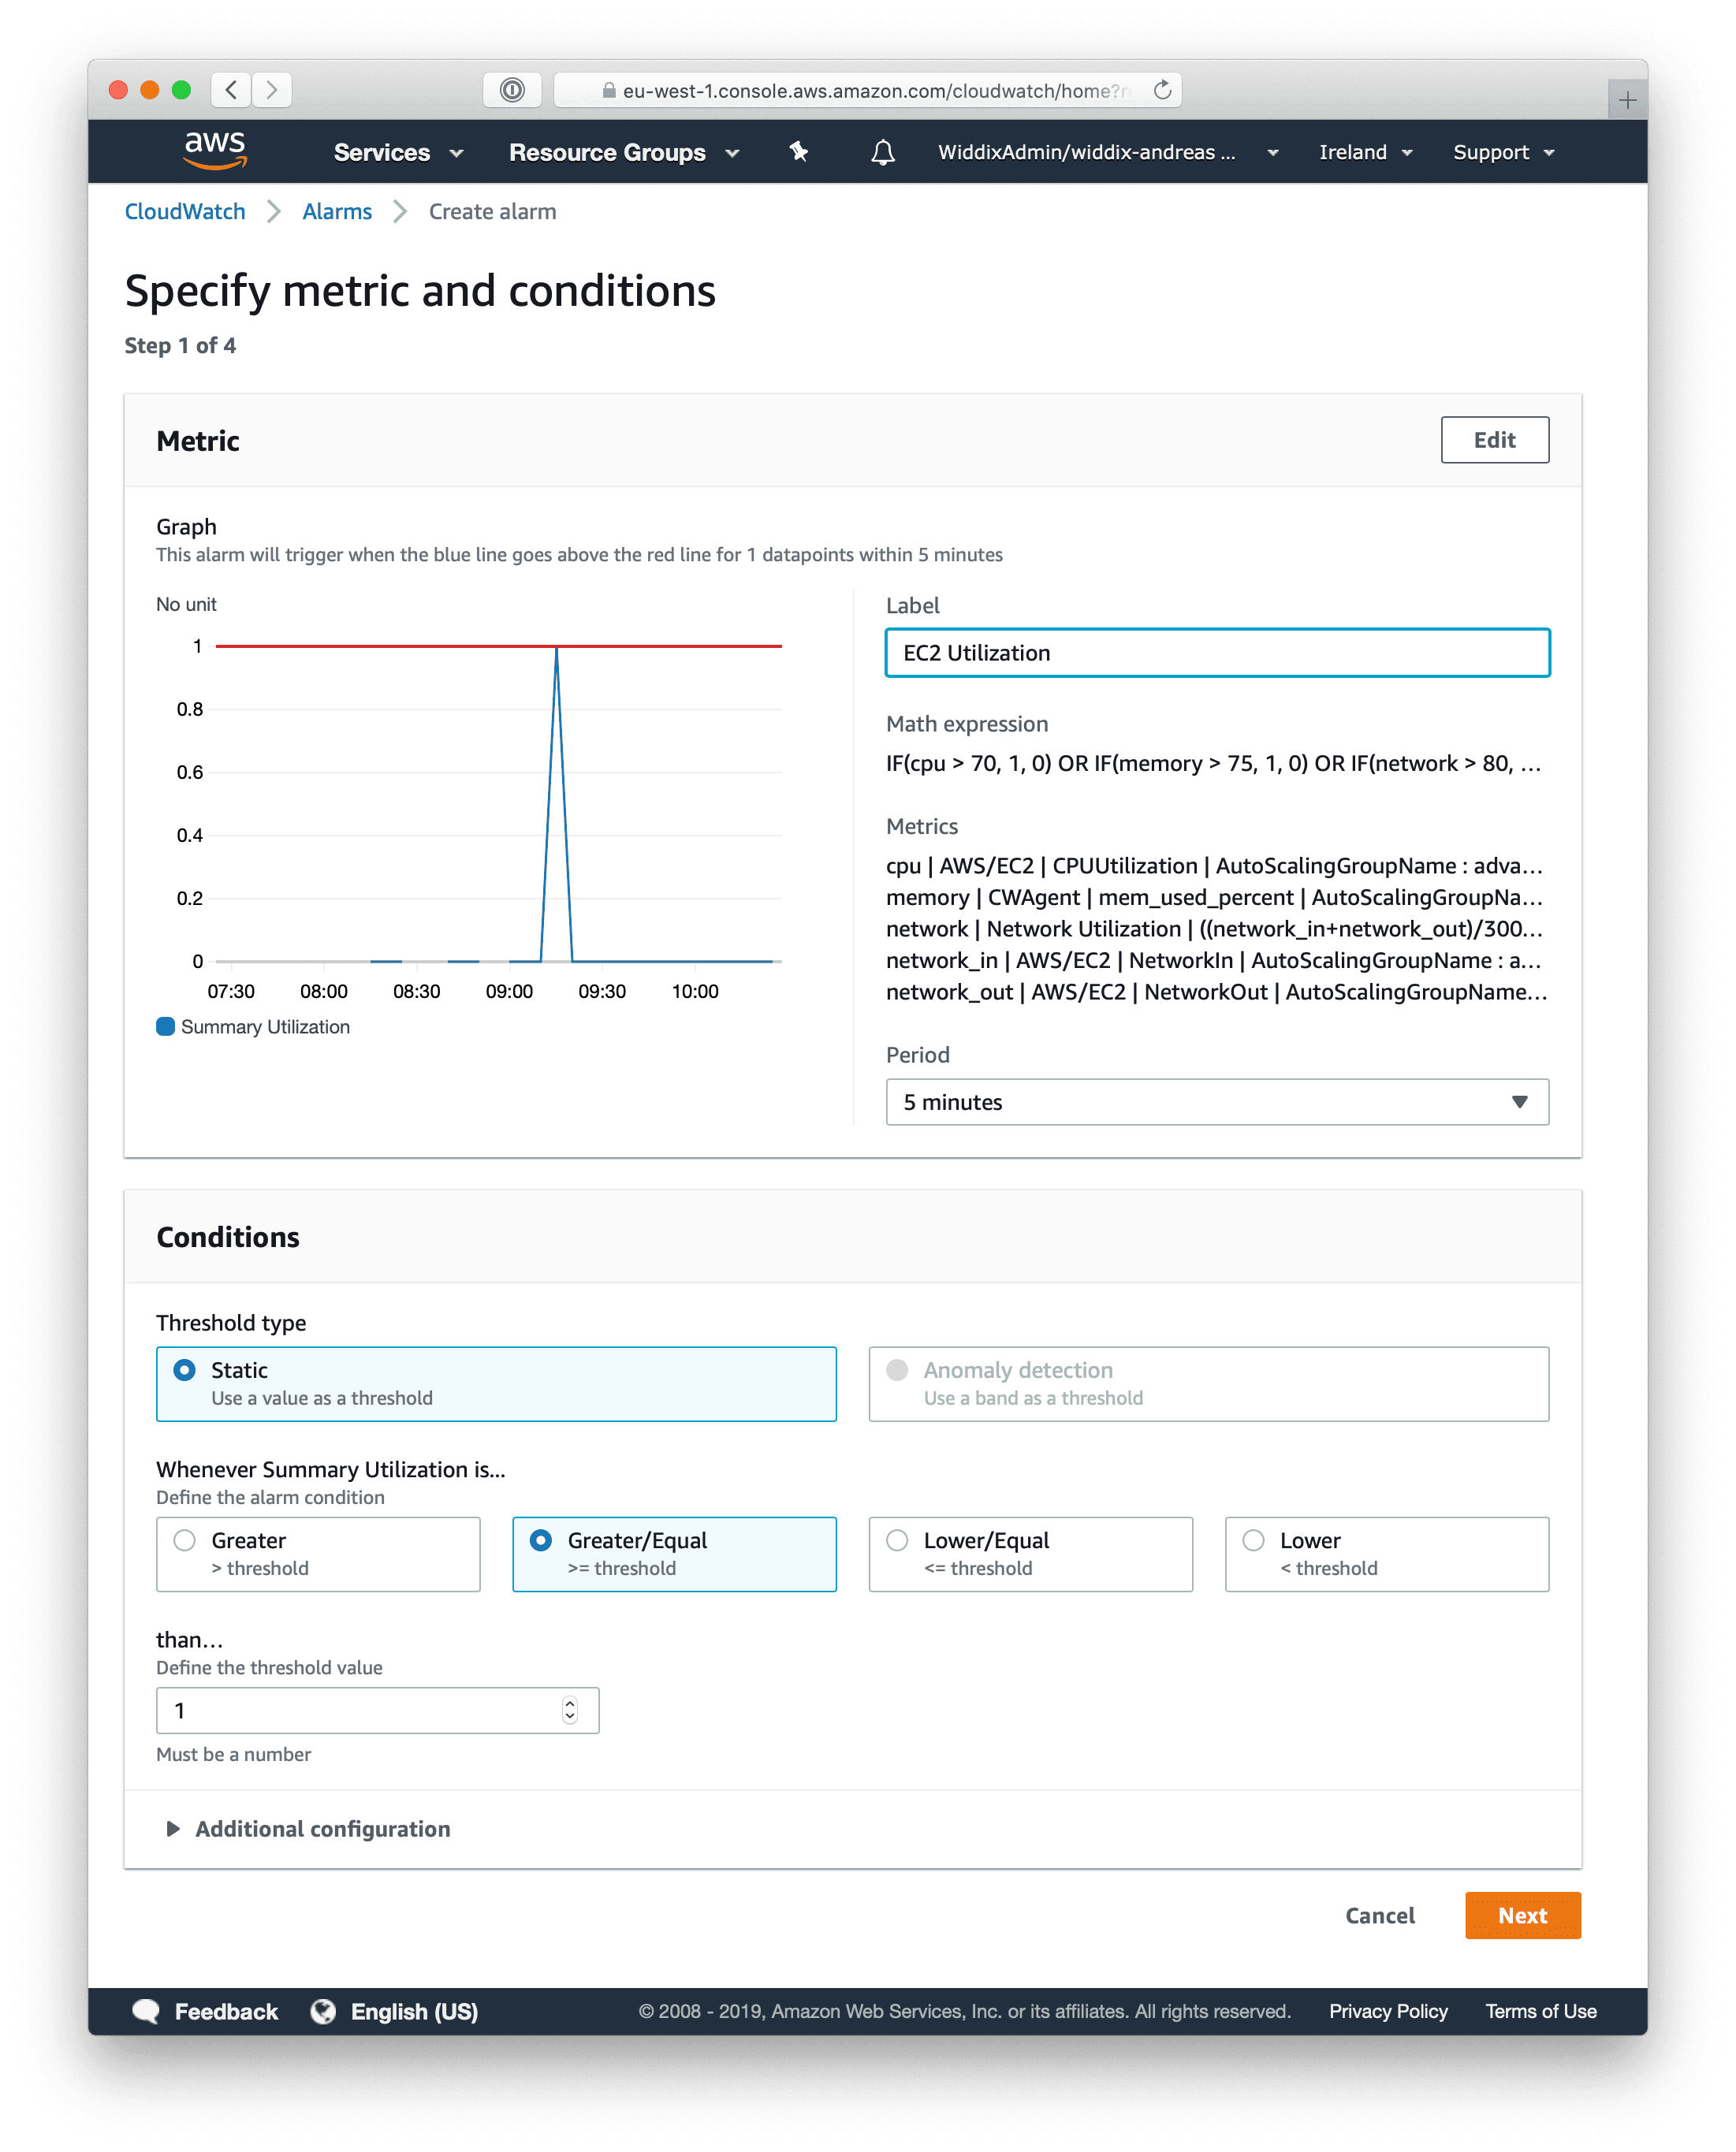
The alarm will transition into the ALARM state when the CPU utilization is above 70%, or the memory utilization is above 75%, or the network utilization is above 80%. Configure the CloudWatch alarm to send a notification or increase the desired capacity of the Auto Scaling Group.
Do you prefer Infrastructure as Code? The following code snippet shows how to create the CloudWatch alarm with the help of CloudFormation.
Note: The example assumes that you are running a
m5.largeinstance with a maximal network throughout of about 0.75 Gbit/s.
AWSTemplateFormatVersion: '2010-09-09' |
That’s all. Happy monitoring!
Summary
As CloudWatch metric math supports IF/AND/OR statements, it is possible to aggregate multiple metrics into a single metric. Doing so allows you to scale an Auto Scaling Group based on multiple metrics as well as reduce the number of CloudWatch alarms, which reduces costs.
Take your AWS monitoring to a new level! Chatbot for AWS Monitoring: Configure monitoring, escalate alerts, solve incidents.

Andreas Wittig
Consultant focusing on Amazon Web Services (AWS). Entrepreneur building marbot.io. Author of Amazon Web Services in Action, Rapid Docker on AWS, and cloudonaut.io.
You can contact me via Email, Twitter, and LinkedIn.
Published on