Monitoring EC2 network utilization with CloudWatch metrics and alarms
Andreas Wittig – 02 May 2019
Are you monitoring the network utilization of your EC2 instances? Why not? The network is one of the rare resources that will limit your workload’s maximum throughput:
- CPU
- Memory
- Network
- Disk
- GPU
I’ve debugged performance problems in a lot of infrastructures during the last 12 months. In most of the scenarios, the network capabilities of EC2 or RDS instances was the bottleneck causing troubles. That is why I want to share with you how to monitor the network utilization of EC2 instances.

To monitor the networking utilization of an EC2 instance, we need to solve two challenges.
Challenge #1: What’s the network performance of my EC2 instance?
To be able to monitor the network utilization of your EC2 instance, you need to be able to answer the following question. What are the baseline and maximum network throughput of your EC2 instance? Unfortunately, AWS does not provide accurate information about the network performance for most instance types. For example, AWS promises Moderate network performance for a t2.xlarge instance or Up to 10 Gbps for a m5.large instance.
This provided information is not satisfactory. That is why I ran a network performance benchmark and published the results at EC2 Network Performance Cheat Sheet. The results are astonishing.
An m5.large instance provides 10.04 Gbit/s for a few minutes only. Afterward, the baseline network performance for an m5.large instance is around 0.74 Gbit/s. The results for other instance types look similar.
The EC2 Network Performance Cheat Sheet gives you an estimation for the baseline and maximum network throughput of your EC2 instance which allows you to define a threshold for monitoring.
Fine, we have solved the challenge #1.
Challenge #2: How to combine multiple CloudWatch metrics?
Each EC2 instance reports various metrics to CloudWatch. The metrics NetworkIn and NetworkOut collect the number of bytes received on all network interfaces by the instance. However, to calculate the network utilization of your EC2 instance, you need to add up both metrics.
Pick one of the following options to create a CloudWatch alarm monitoring the total network utilization of your EC2 instance:
- Use the AWS Management Console to create the CloudWatch alarm manually.
- Use CloudFormation to create the CloudWatch alarm with Infrastructure as Code.
- Let marbot create the CloudWatch alarm for you.
Monitoring Assistant
Ask marbot to monitor EC2 instances for you and receive alerts in Slack or Microsoft Teams.It couldn't be easier!
- Add marbot to Slack or Microsoft Teams.
- Invite marbot to a channel.
- Follow the setup wizard.
AWS Management Console
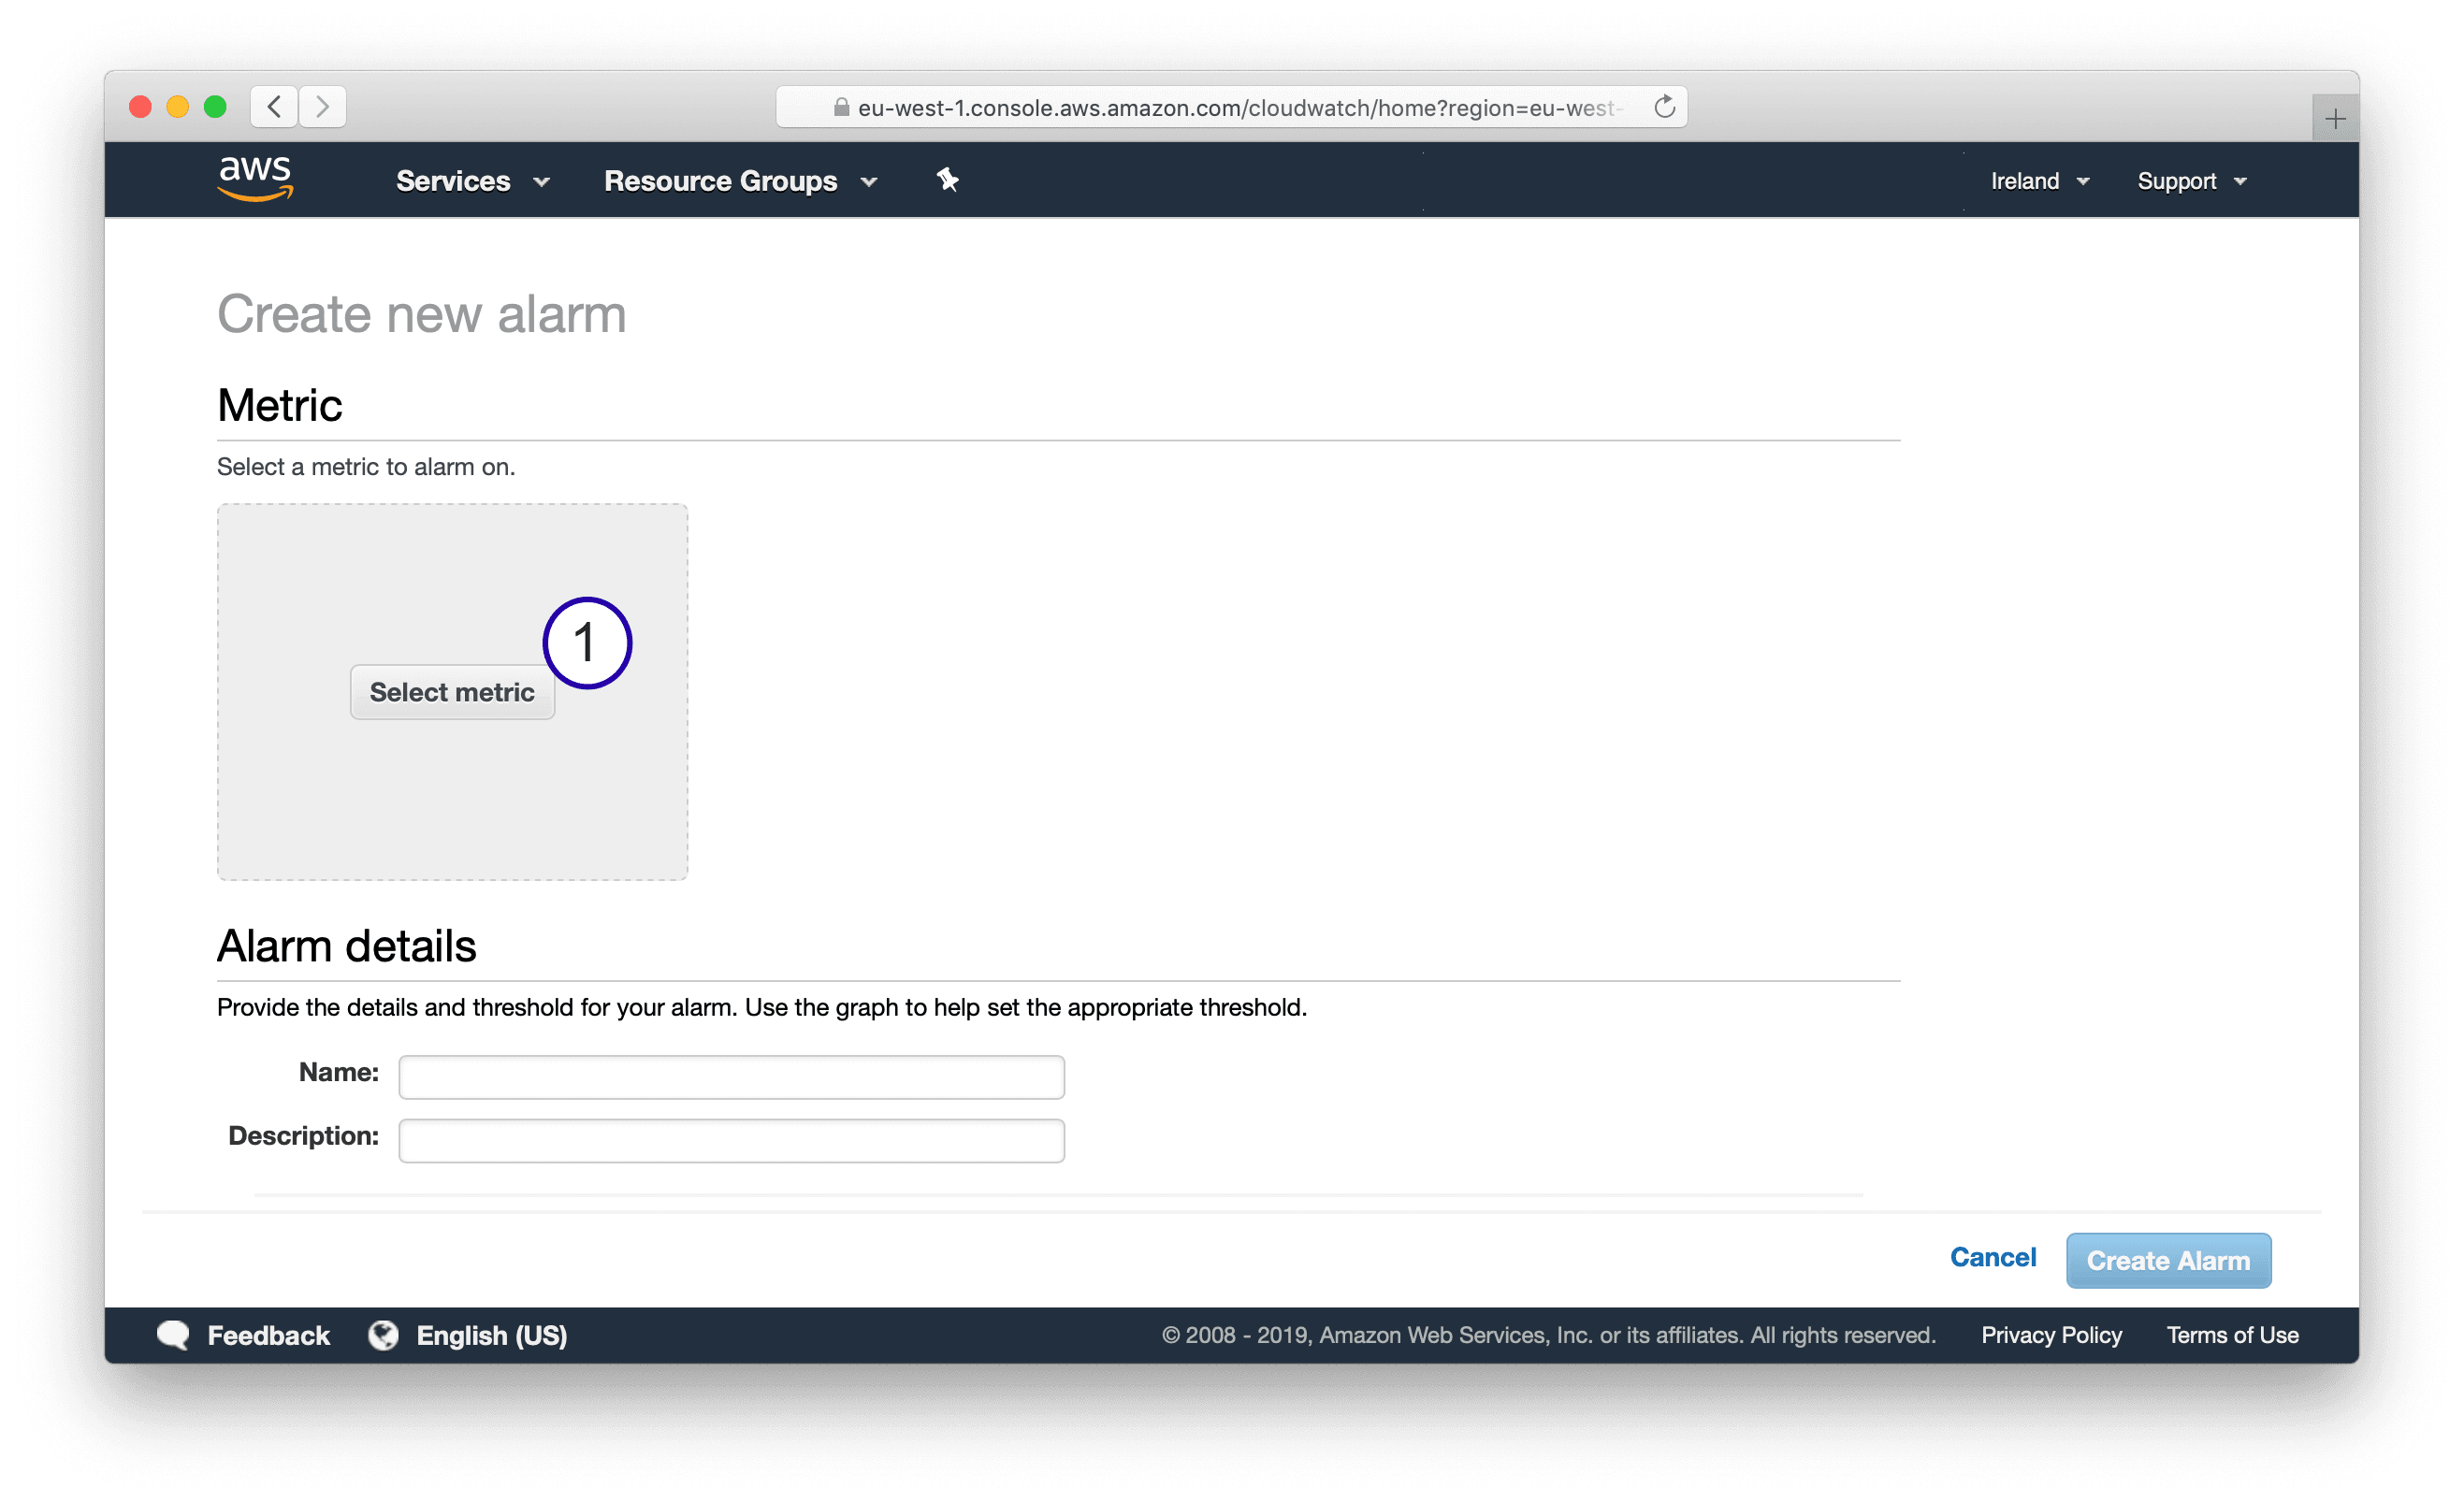
Log into the AWS Management Console and go to CloudWatch. Select Alarms from the sub-navigation and click the Create Alarm button. The wizard shown in the following screenshot appears. Click the Select metric button.
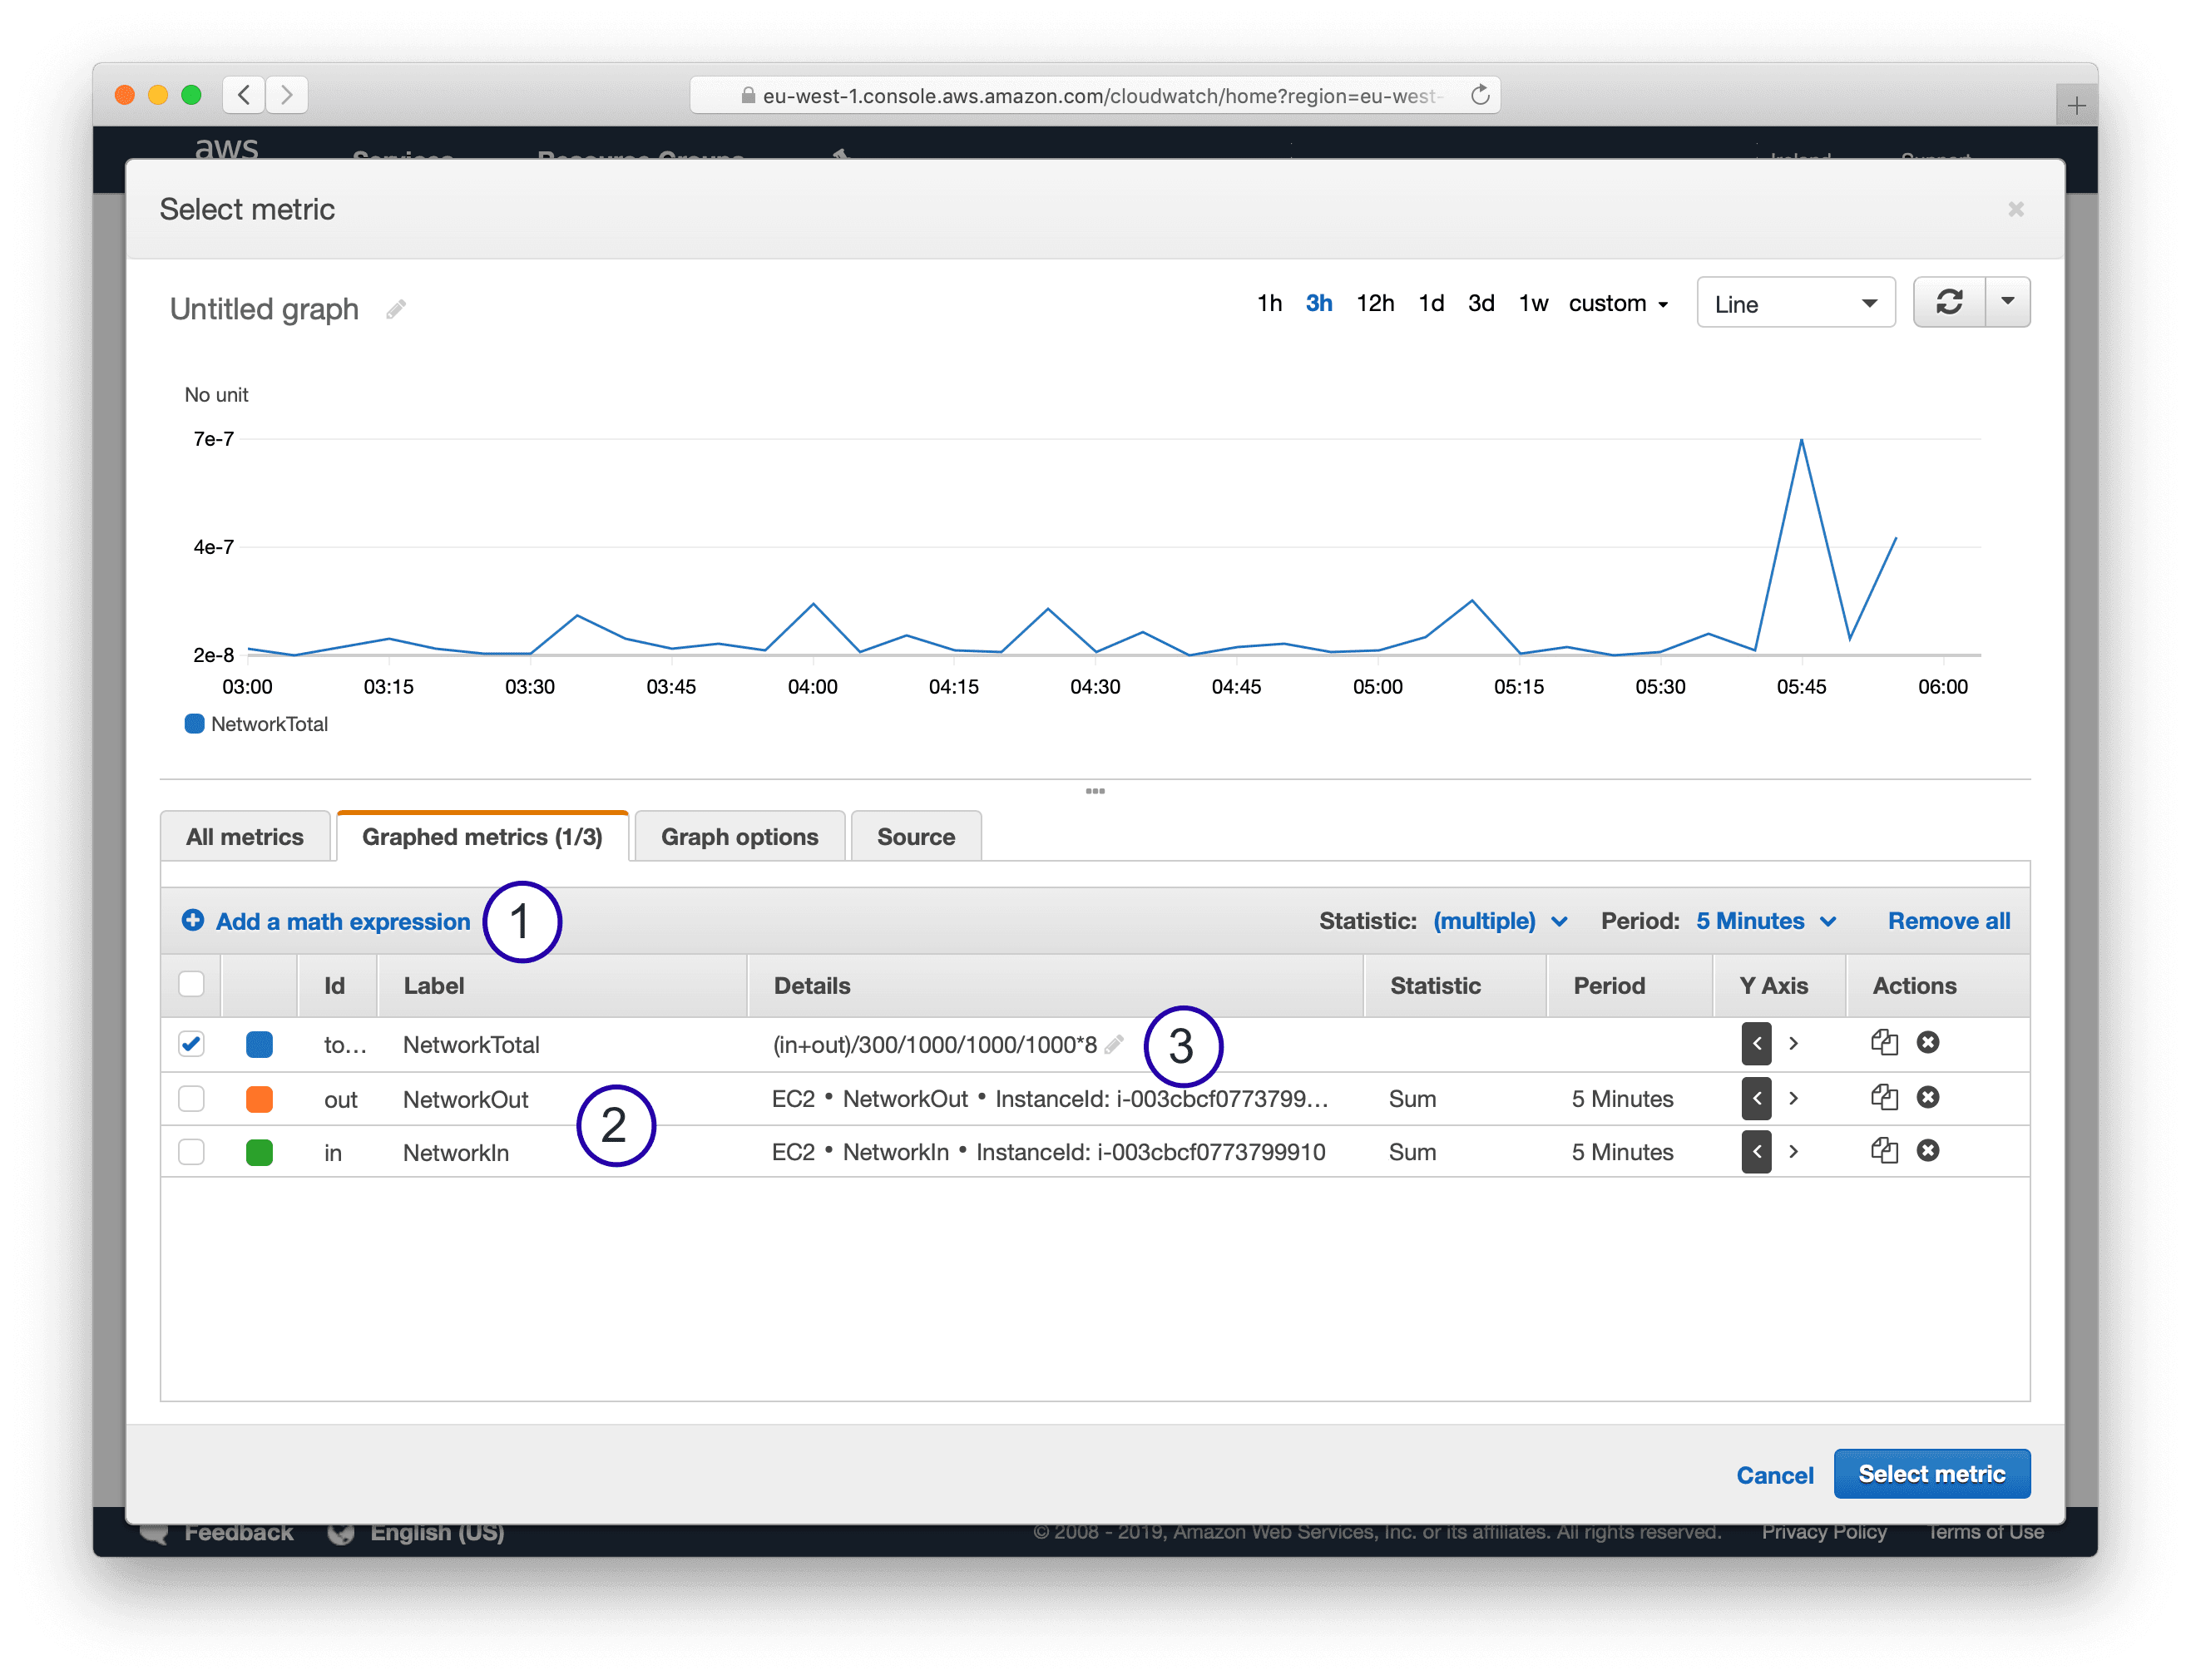
Search for the NetworkIn and NetworkOut metrics of your EC2 instance and select them both. After doing so, select the Graphed metrics tab.
- Click
Add a math expression. - Type in id
outfor theNetworkOutmetric andinfor theNetworkInmetric. - Type in the expression
(in+out)/300/1000/1000/1000*8.
Let me quickly explain the math expression (in+out)/300/1000/1000/1000*8:
- Add up
inandout. - Divide by
300to convert from 5 minutes to 1 second. - Divide by
1000/1000/1000*8to convert Byte in Gbit.
Make sure you have only selected the math expression before you click the Select metric button.
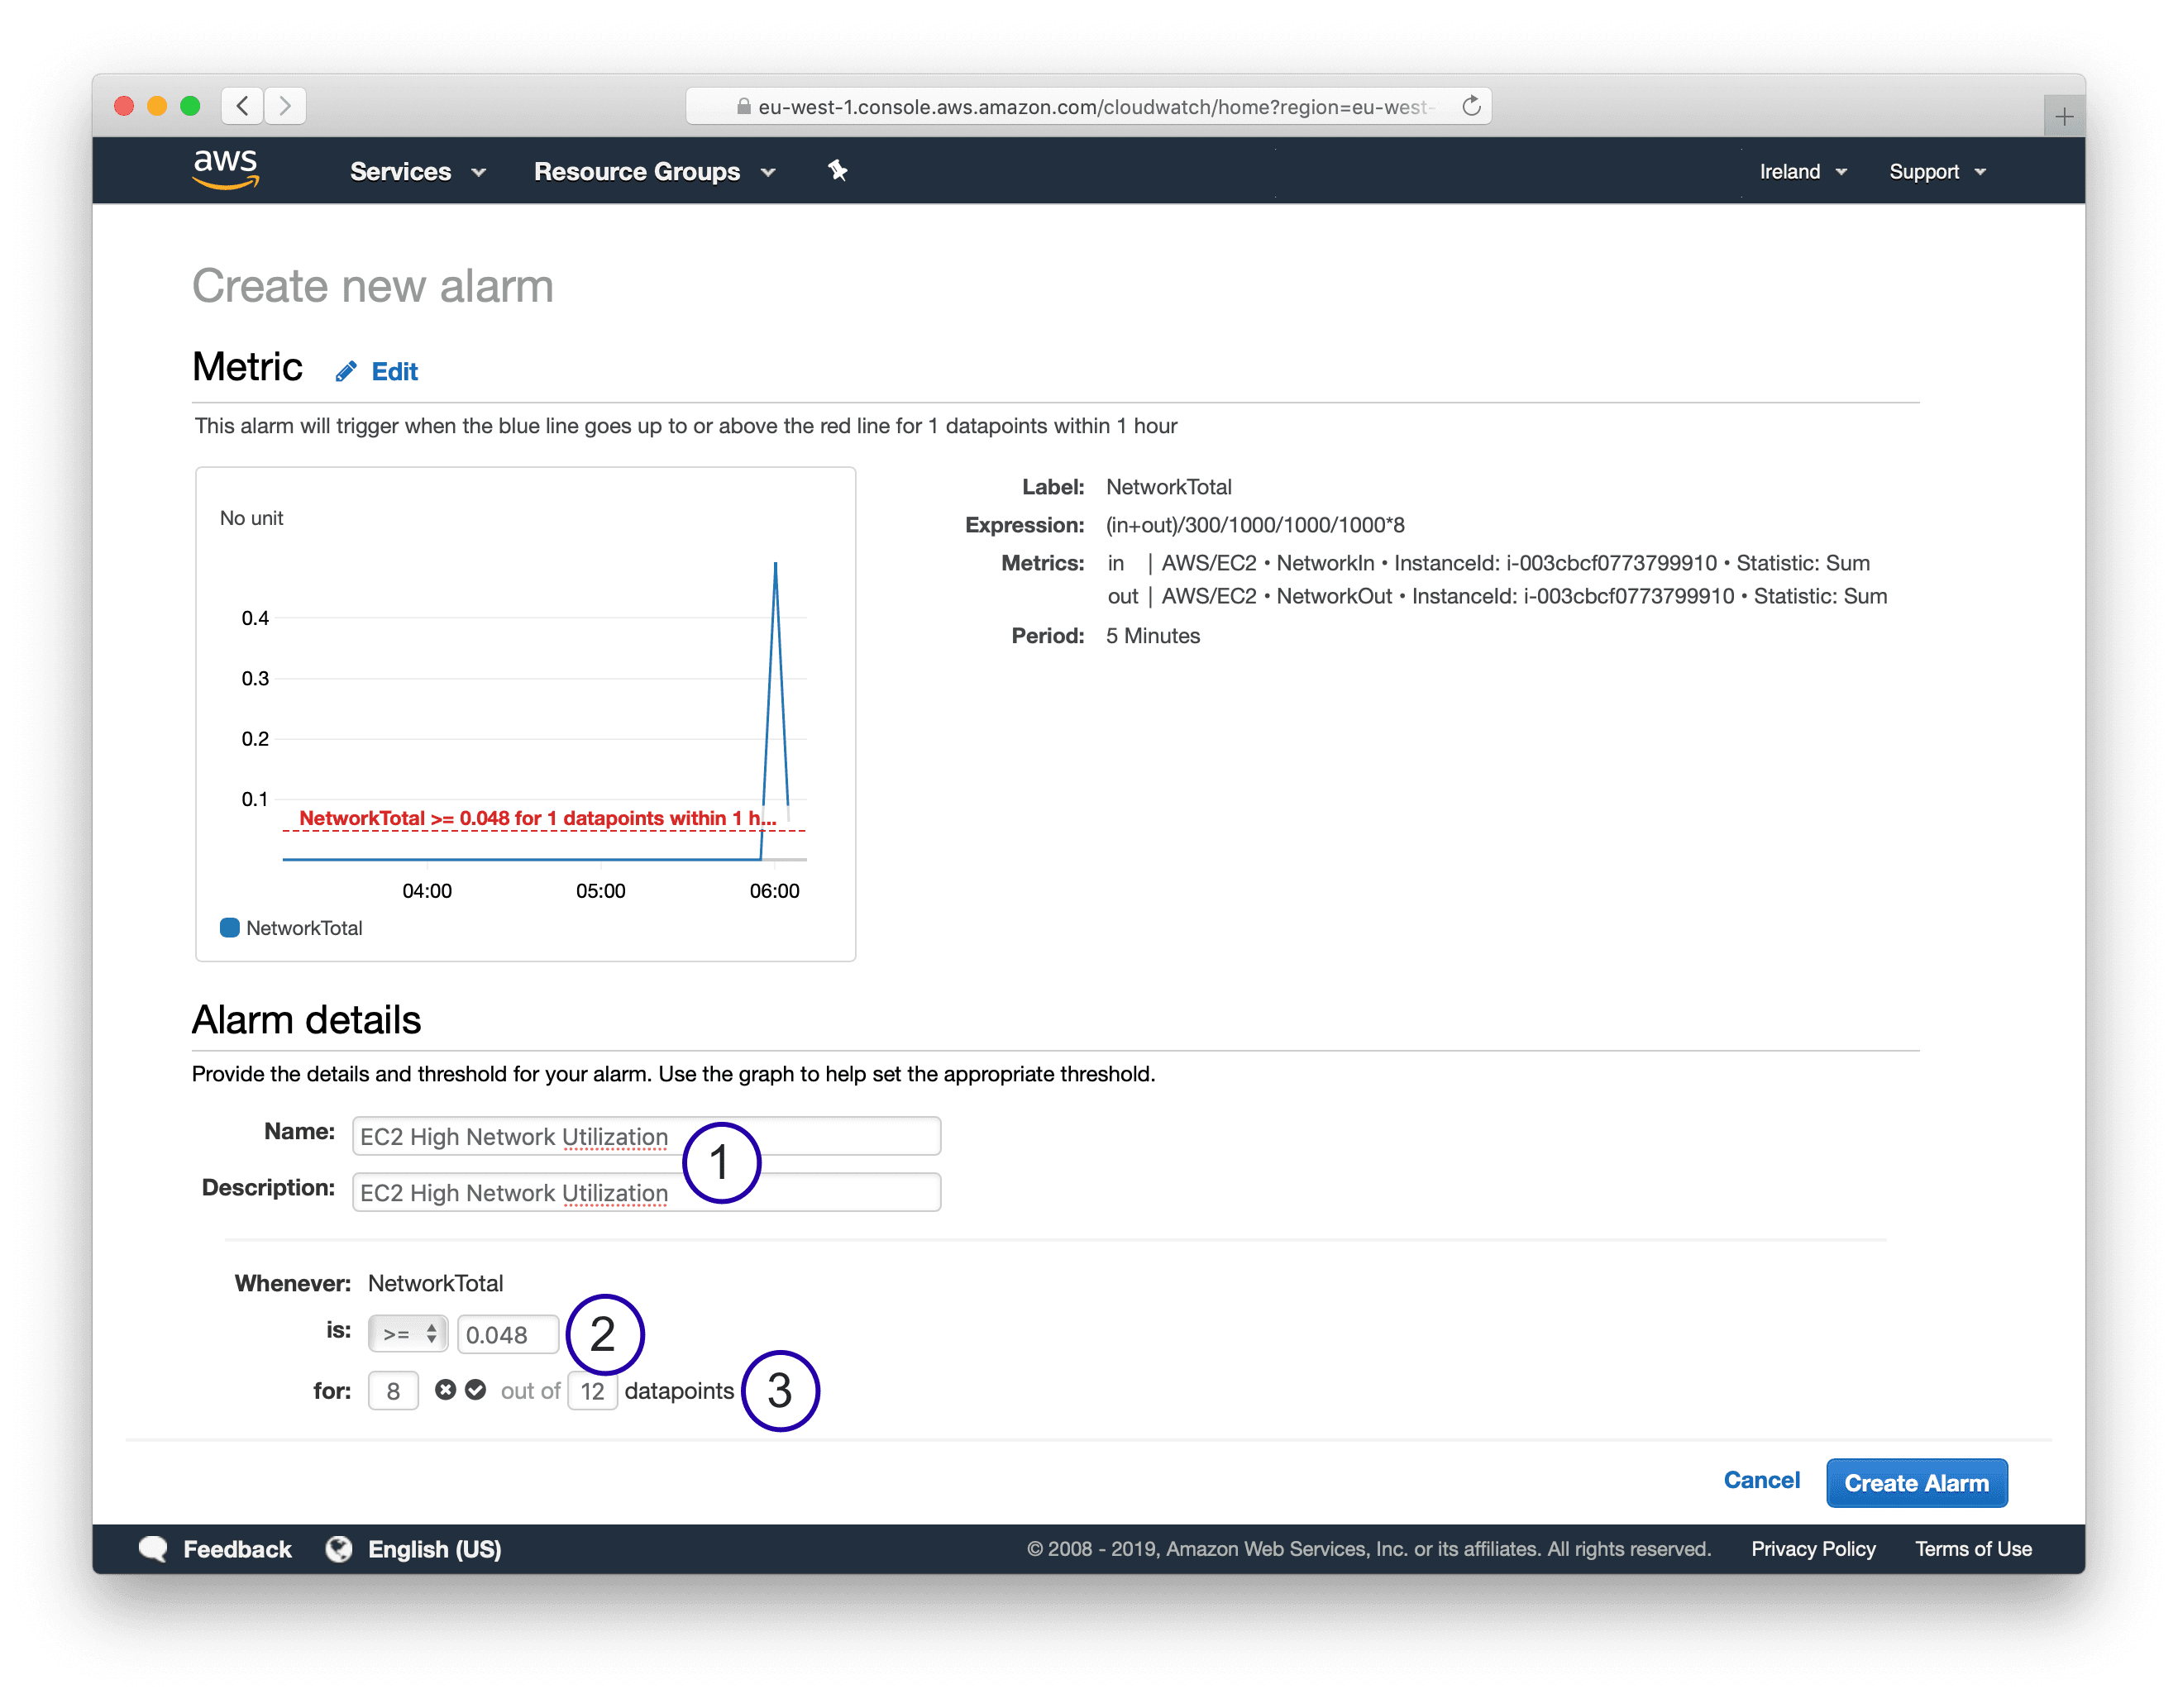
Finally, set up the alarm.
- Type in a name and description.
- Define the threshold. For example, 80% of the baseline network performance listed in the EC2 Network Performance Cheat Sheet.
- To avoid alarms from short network utilization spikes configure
8 out of 12 datapoints. Which translates to 45 minutes within an hour.
Click the Create Alarm button.
Fine, you have set up a CloudWatch alarm monitoring the network utilization of your EC2 instance.
Instead of going through this process manually, you could create CloudWatch alarms in an automated way with the help of CloudFormation as well.
CloudFormation
The following snippet shows a CloudFormation template setting up a CloudWatch alarm monitoring the network utilization of an EC2 instance.
You need to modify the Threshold. I suggest 80% of the network baseline performance as listed in the EC2 Network Performance Cheat Sheet.
AWSTemplateFormatVersion: '2010-09-09' |
ChatOps
Are you looking for an, even more, simpler way to monitor the network utilization of your EC2 instance?
Monitoring Assistant
Ask marbot to monitor EC2 instances for you and receive alerts in Slack or Microsoft Teams.It couldn't be easier!
- Add marbot to Slack or Microsoft Teams.
- Invite marbot to a channel.
- Follow the setup wizard.
It couldn’t be easier!
Summary
Monitoring the network utilization of your EC2 instance is essential, as the network is a limited resource. The instance type affects maximum and baseline performance. Your EC2 instance might not be able to provide the maximum network performance for more than 5 to 30 minutes. Therefore, use the baseline performance to define the alarm threshold. Use EC2 Network Performance Cheat Sheet to get an estimation of the network performance of your EC2 instance.
Take your AWS monitoring to a new level! Chatbot for AWS Monitoring: Configure monitoring, escalate alerts, solve incidents.

Andreas Wittig
Consultant focusing on Amazon Web Services (AWS). Entrepreneur building marbot.io. Author of Amazon Web Services in Action, Rapid Docker on AWS, and cloudonaut.io.
You can contact me via Email, Twitter, and LinkedIn.
Published on