Smart alert escalation for Sumo Logic Scheduled Searches for Logs and Monitors for Metrics
Michael Wittig – 09 Feb 2018
Sumo Logic provides a unified platform for all logs and metrics. Analyze all data in real-time and monitor apps and infrastructure in real-time. Scheduled Searches are saved searches that run automatically at specified intervals against your logs and can trigger an action. Monitors watch a time series to alert when the metric has crossed a static threshold. Sumo Logic Scheduled Searches and Monitors also integrate with Slack, but the native integration lacks many features, such as:
- Smart Alert Escalation
- Context-aware Quick Links
- Event Aggregation / Deduplication
With marbot, you get the missing features to manage Sumo Logic Alerts in a team that cares about production.
Set up instructions
First of all, you need to create a WebHook connection to enable Sumo Logic to integrate with marbot.
WebHook connection
- Create a free Sumo Logic trial account.
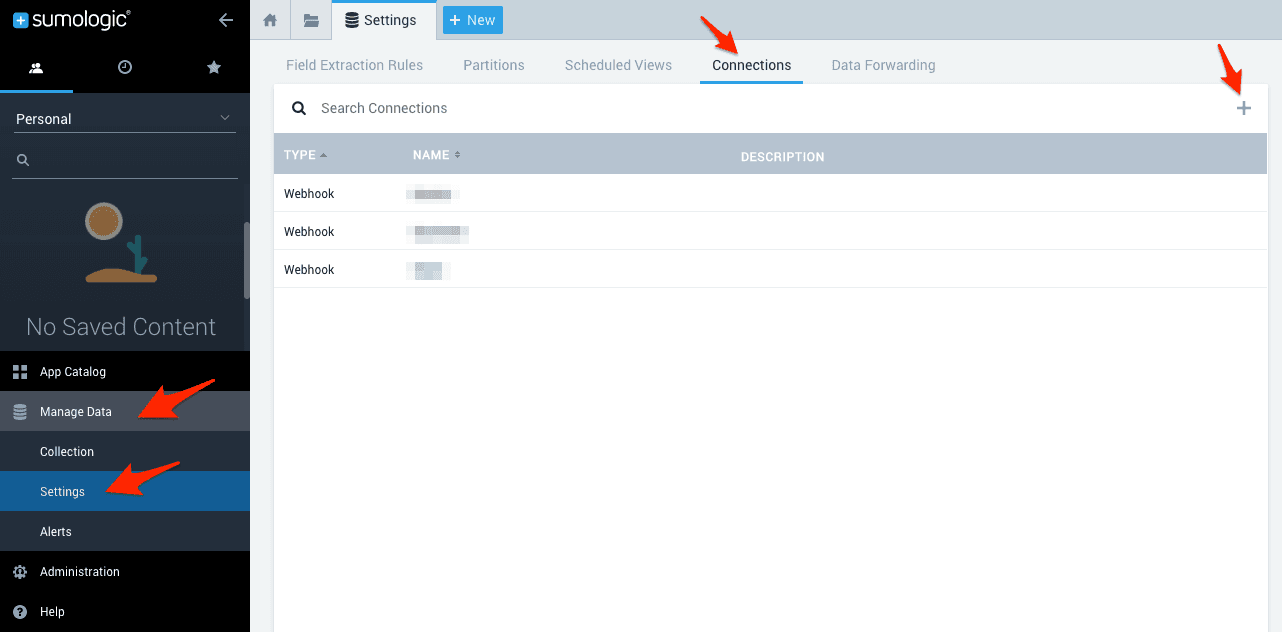
- Log in to your Sumo Logic account.
- Click on Manage Date at the bottom right and then click on Settings.
- Click on Connections at the top.
- Click the plus button on the top right.
- Select the connection type
Webhook.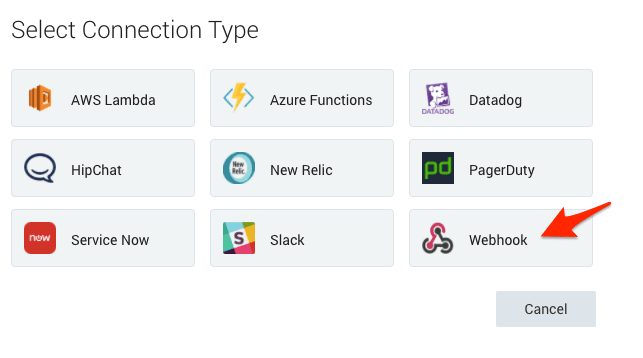
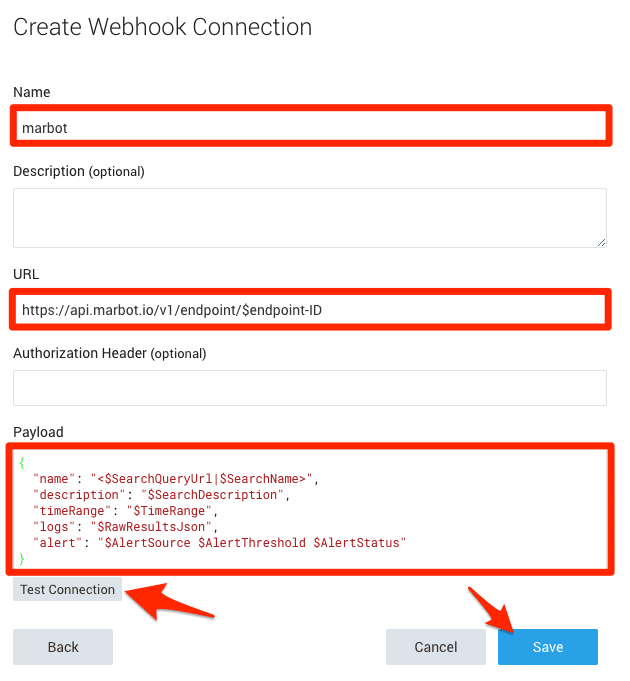
- Set Name to
Name. - Set URL to
https://api.marbot.io/v1/endpoint/$endpoint-ID. Replace$endpoint-IDwith the ID of your endpoint. You can get this value by asking @marbot for it on your Slack channel. - Set Payload to:
{ |
- Click on Test Connection to simulate an alert.
- Click on Save.
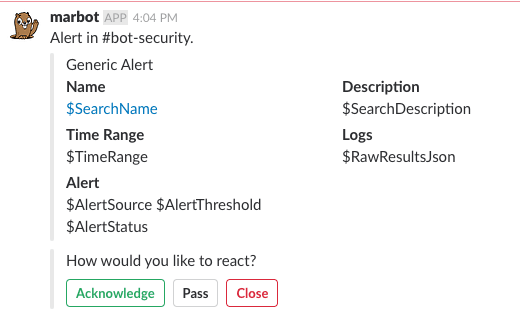
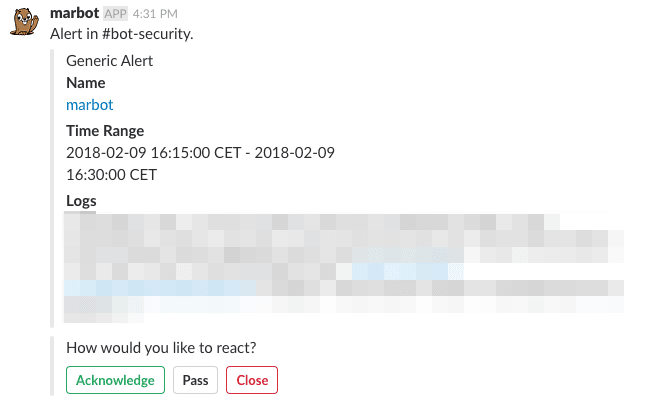
The following alert will be delivered by marbot soon.
Now, you can create a Scheduled Search or Monitor to send alerts to marbot.
More information: Sumo Logic documentation
Scheduled Search
- Click on New at the top and then click on Log Search.
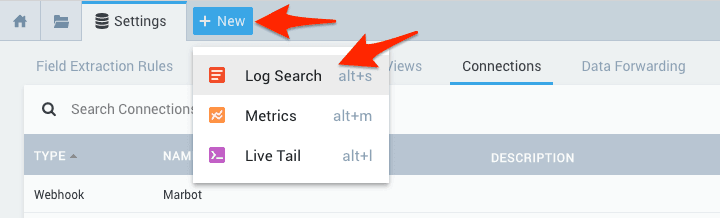
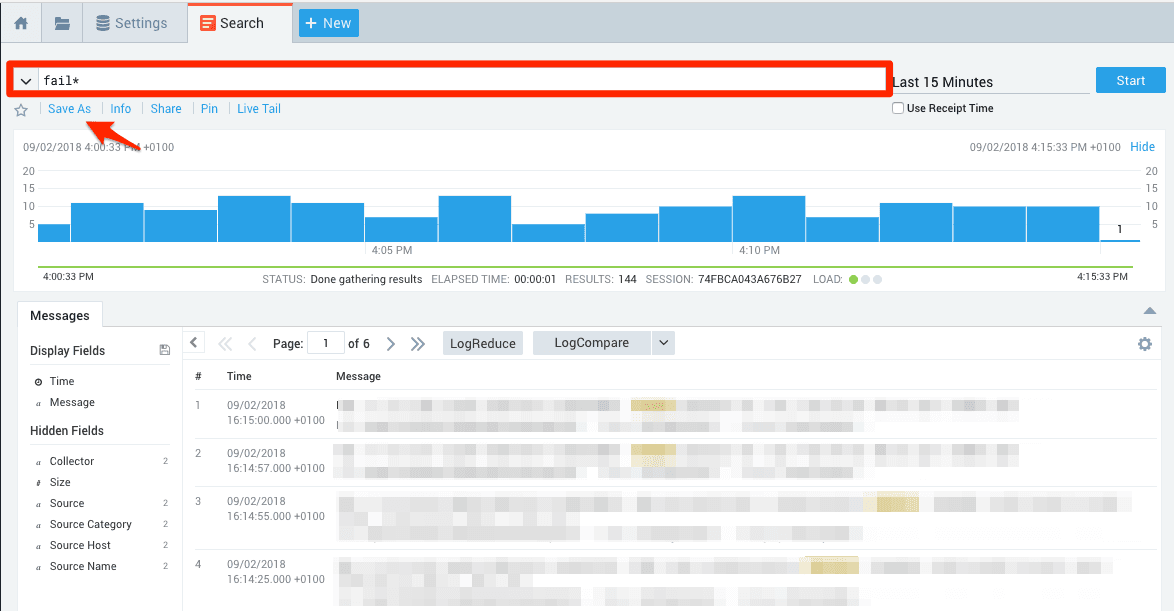
- Formulate a search query. E.g., all logs that contain
fail*. - Once the query returns the desired results, click on Save as.
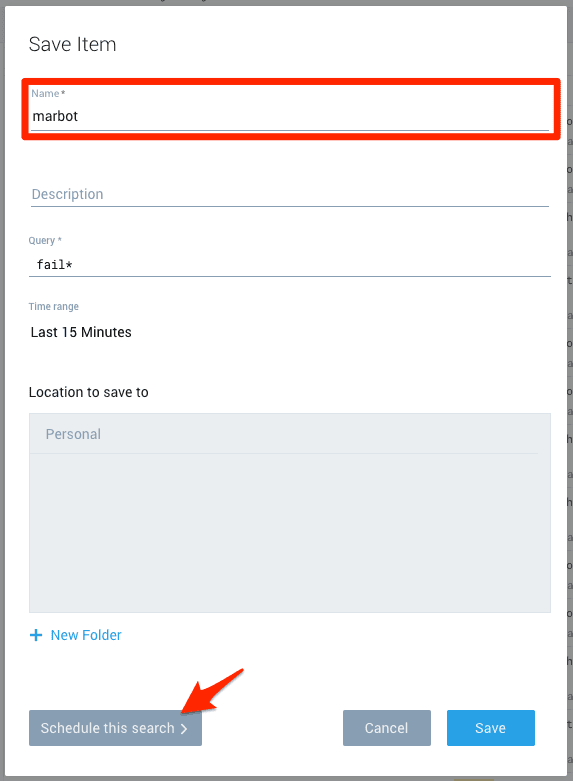
- Set Name to
marbot. - Click on Schedule this search.
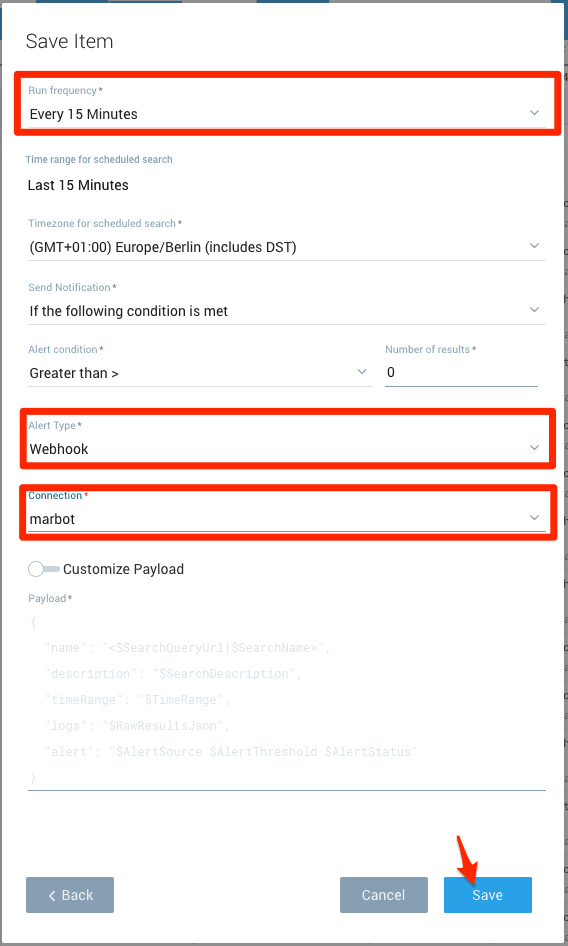
- Set Run frequency to
Every 15 minutes - Set Alert Type to
Webhook. - Set Connection to
marbot. - Click on Save.
A Scheduled Search alert delivered by marbot will look like this:
More information: Sumo Logic documentation
Read one, if you want to configure which fields are displayed by marbot.
Configure alert fields
Available variables are:
$SearchName: Name of the saved search or Monitor.$SearchDescription: Description of the saved search or Monitor.$SearchQuery: The query used to run the saved search.$SearchQueryUrl: The URL link to the search or metrics query.$TimeRange: Time range used to run the search or time range that triggered the metrics alert.$FireTime: The start time of the search or time that metrics alert triggered.$AggregateResultsJson: JSON object containing search aggregation results. (Important: A maximum of 200 results for this field can be sent via Webhook.)$RawResultsJson: JSON object containing raw messages. (Important: Only 10 results for this field can be sent via Webhook.)$NumRawResults: Number of results returned by the search. (Important: Only 100 results for this field can be sent via Webhook.)
Example Payload:
{ |
More information: Sumo Logic documentation
Monitor
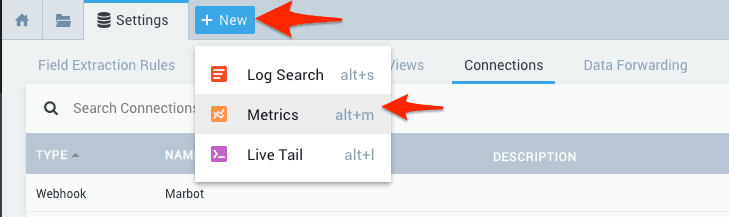
- Click on New at the top and then click on Metrics.
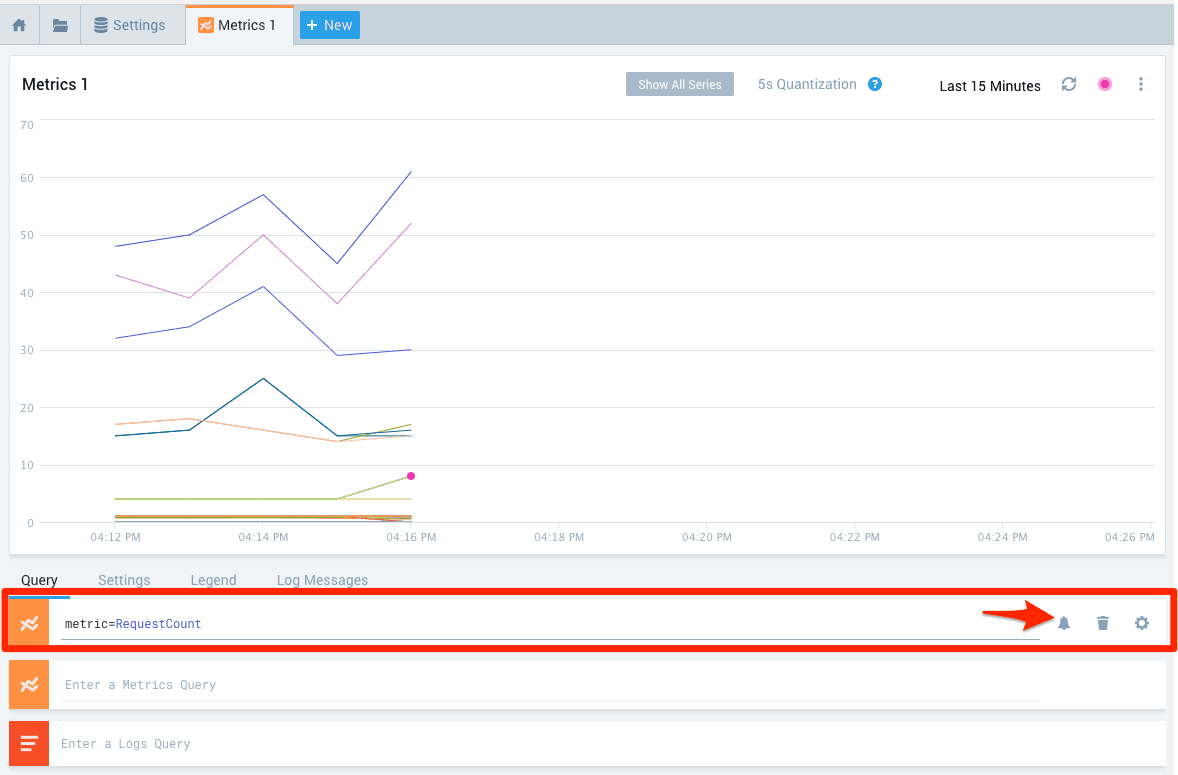
- Formulate a metrics query. E.g., select one metric
metric=RequestCounnt. - Keep your mouse over the metrics query and click on the alert icon.
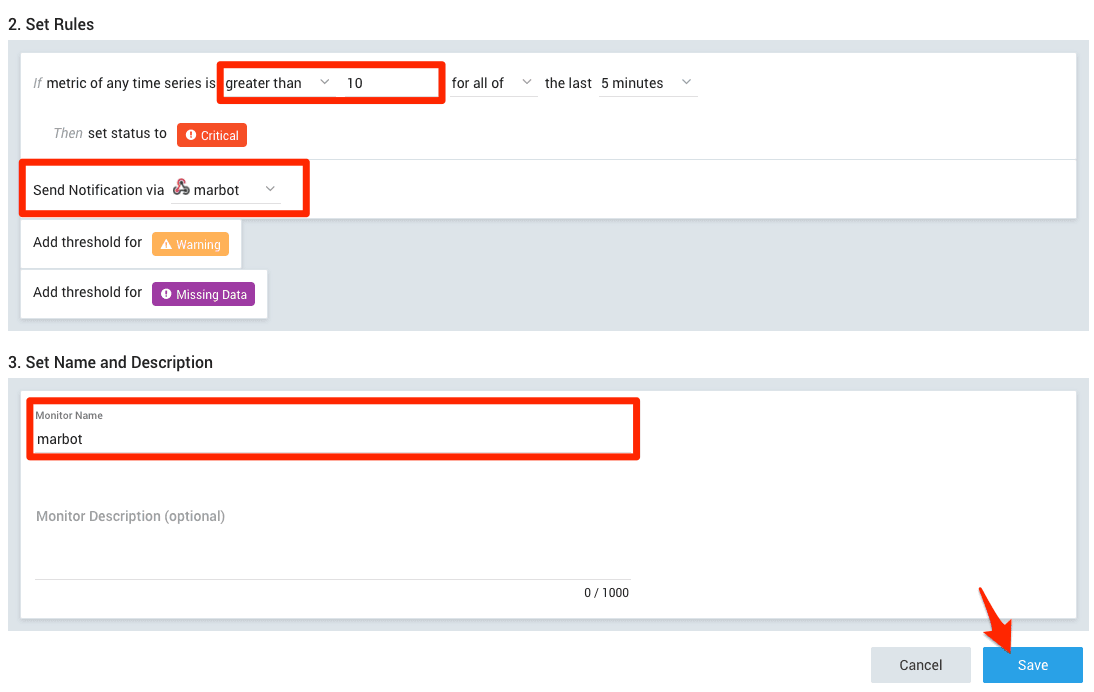
- Click on Set threshold for critical
- Set the threshold to a value that indicates critical system status.
- Set Send Notification via to
marbot. - Set Monitor Name to
marbot. - Click on Save.
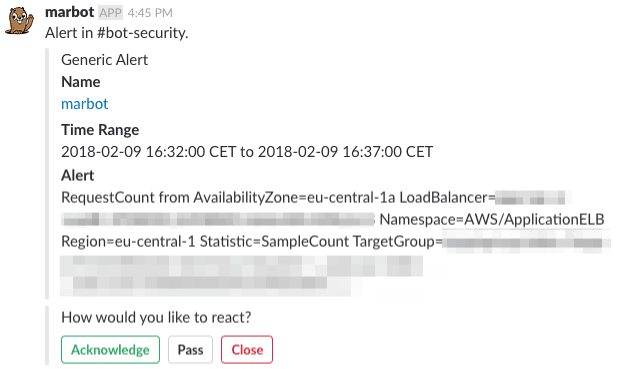
A Scheduled Search alert delivered by marbot will look like this:
More information: Sumo Logic documentation
Read one, if you want to configure which fields are displayed by marbot.
Configure alert fields
$SearchName: Name of the saved search or Monitor.$SearchDescription: Description of the saved search or Monitor.$SearchQuery: The query used to run the saved search.$SearchQueryUrl: The URL link to the search or metrics query.$TimeRange: Time range used to run the search or time range that triggered the metrics alert.$FireTime: The start time of the search or time that metrics alert triggered.$AlertThreshold: The condition that triggered the alert (for example, above 90 at least once in the last 5 minutes).$AlertSource: The metric and sourceHost that triggered the alert.$AlertID: The ID of the triggered alert.$AlertStatus: Current status of the time series that triggered (for example, Critical or Warning).
Example Payload:
{ |
More information: Sumo Logic documentation
Take your AWS monitoring to a new level! Chatbot for AWS Monitoring: Configure monitoring, escalate alerts, solve incidents.

Michael Wittig
Consultant focusing on Amazon Web Services (AWS). Entrepreneur building marbot.io. Author of Amazon Web Services in Action, Rapid Docker on AWS, and cloudonaut.io.
You can contact me via Email, Twitter, and LinkedIn.
Published on