Monitoring: Amazon RDS (Relational Database Service)
Amazon RDS (Relational Database Service) is a web service provided by Amazon Web Services (AWS). It makes setting up, operating, and scaling a relational database in the cloud easier. With Amazon RDS, you can choose from several popular relational database management systems (RDBMS), such as MySQL, PostgreSQL, Oracle, Microsoft SQL Server, and MariaDB.
Why should you monitor Amazon RDS?
Monitoring Amazon RDS is crucial for several reasons: availability, performance, and cost optimization.
- Availability: Monitoring Amazon RDS helps ensure your database is available and accessible to your applications and users.
- Performance: Monitoring Amazon RDS allows you to optimize your database’s performance by identifying and troubleshooting performance issues.
- Cost Optimization: Monitoring Amazon RDS helps you manage costs by identifying and reducing unnecessary database resource usage.
That’s why it is crucial to monitor Amazon RDS.
How does monitoring Amazon RDS work?
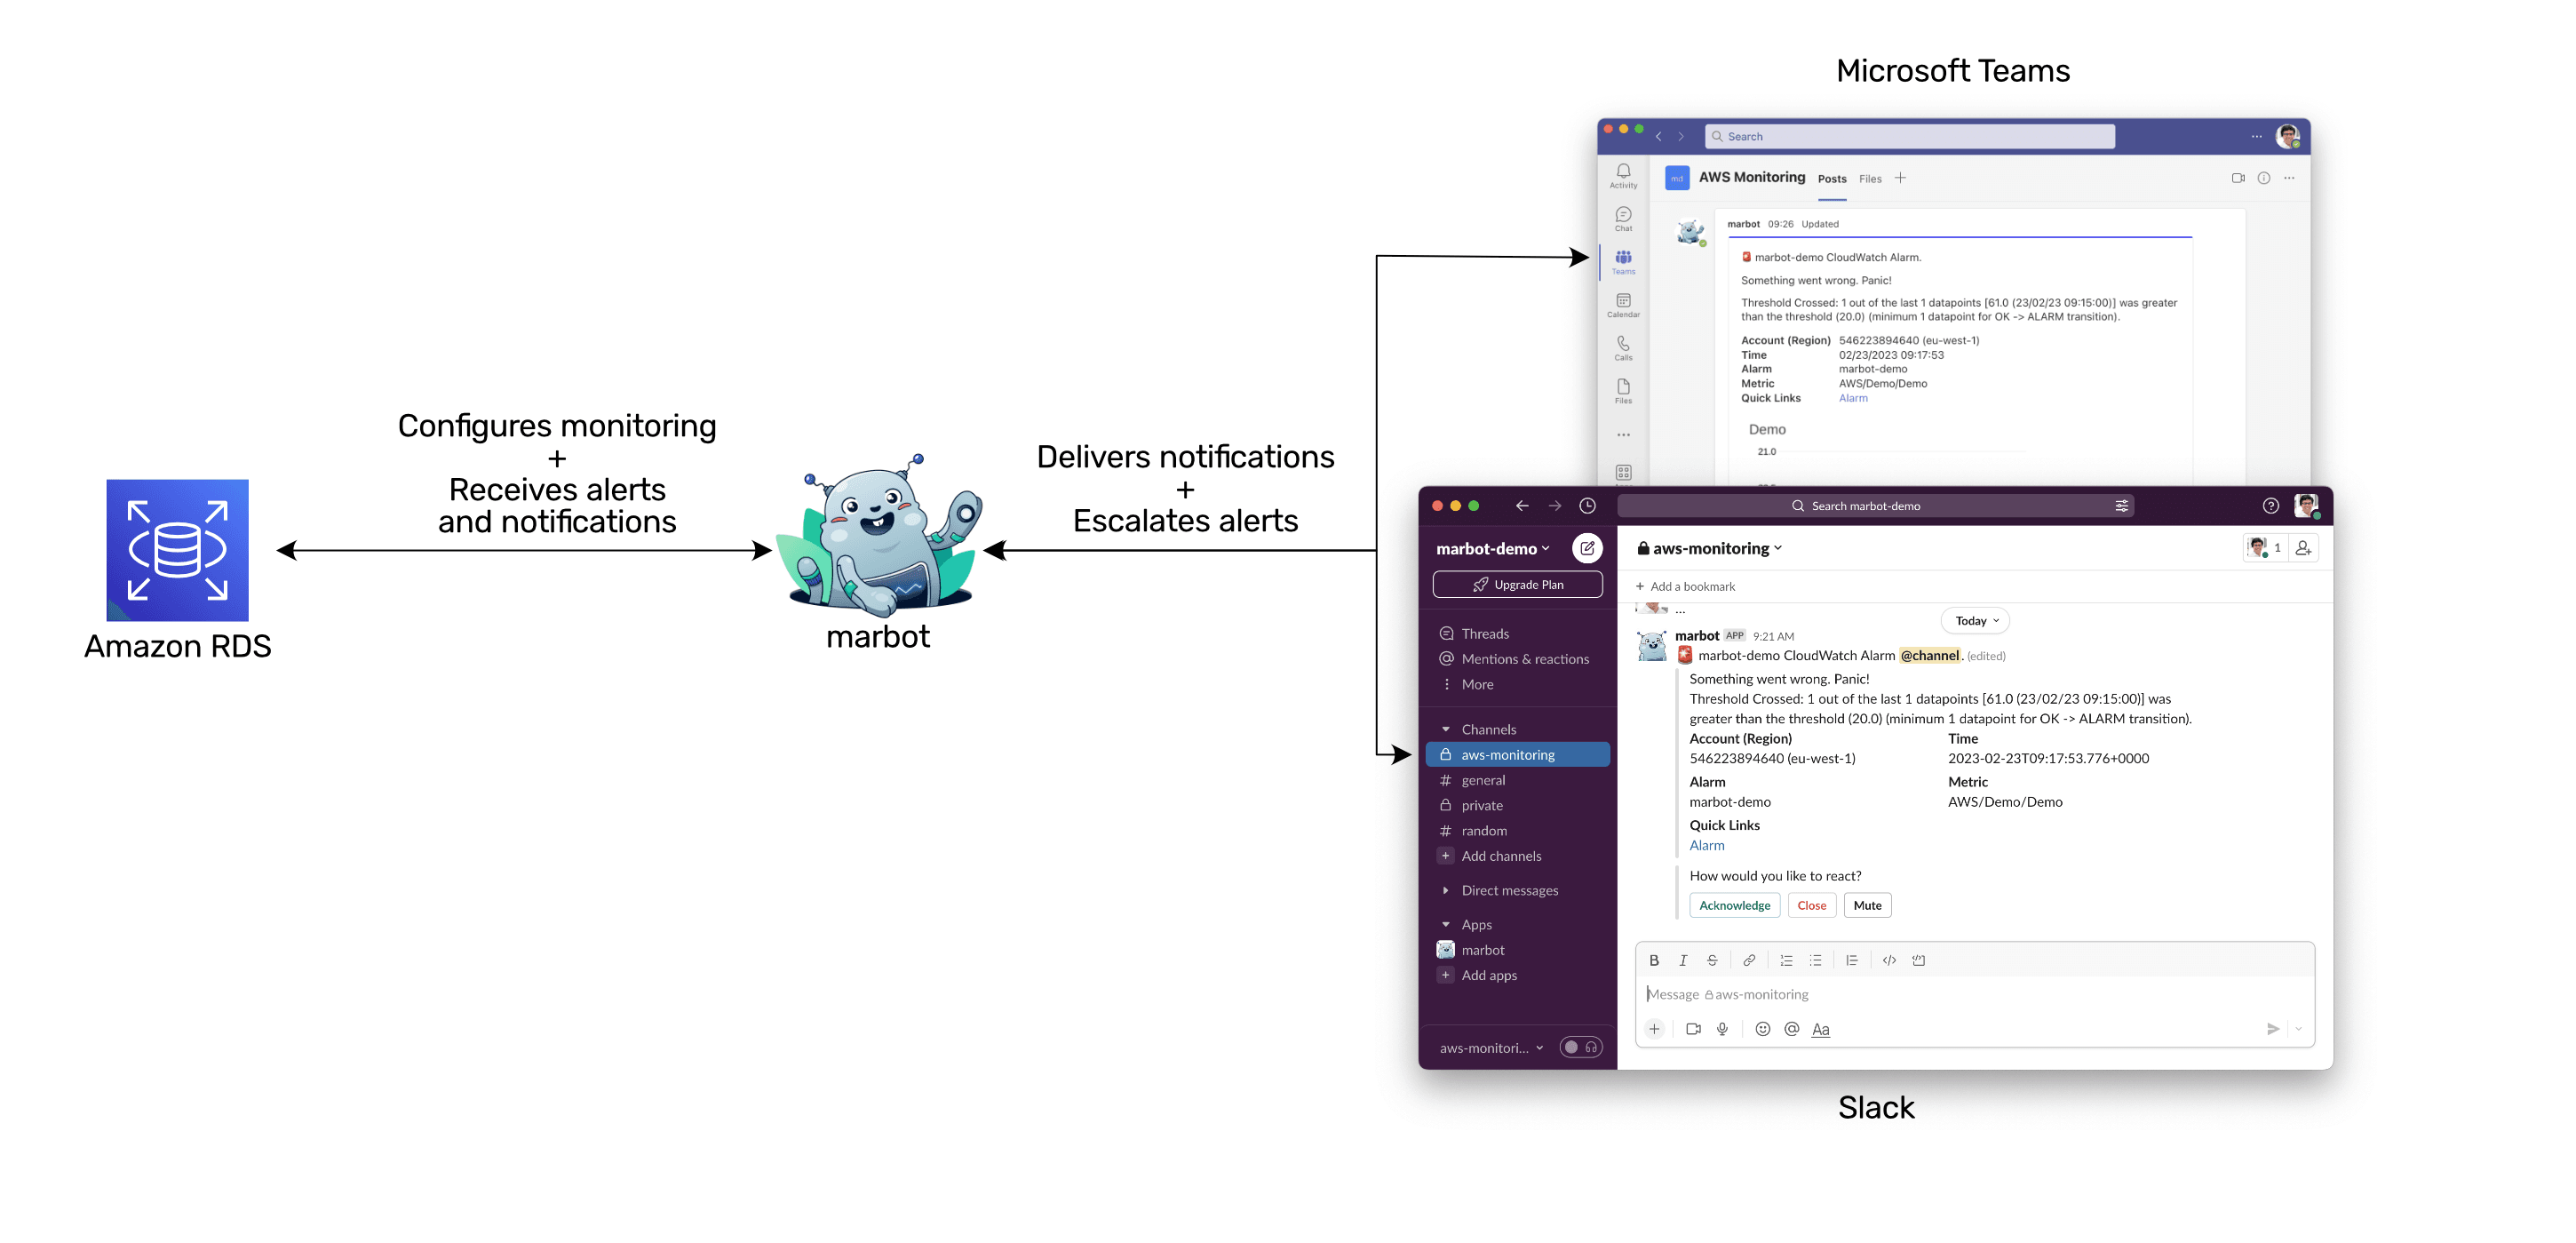
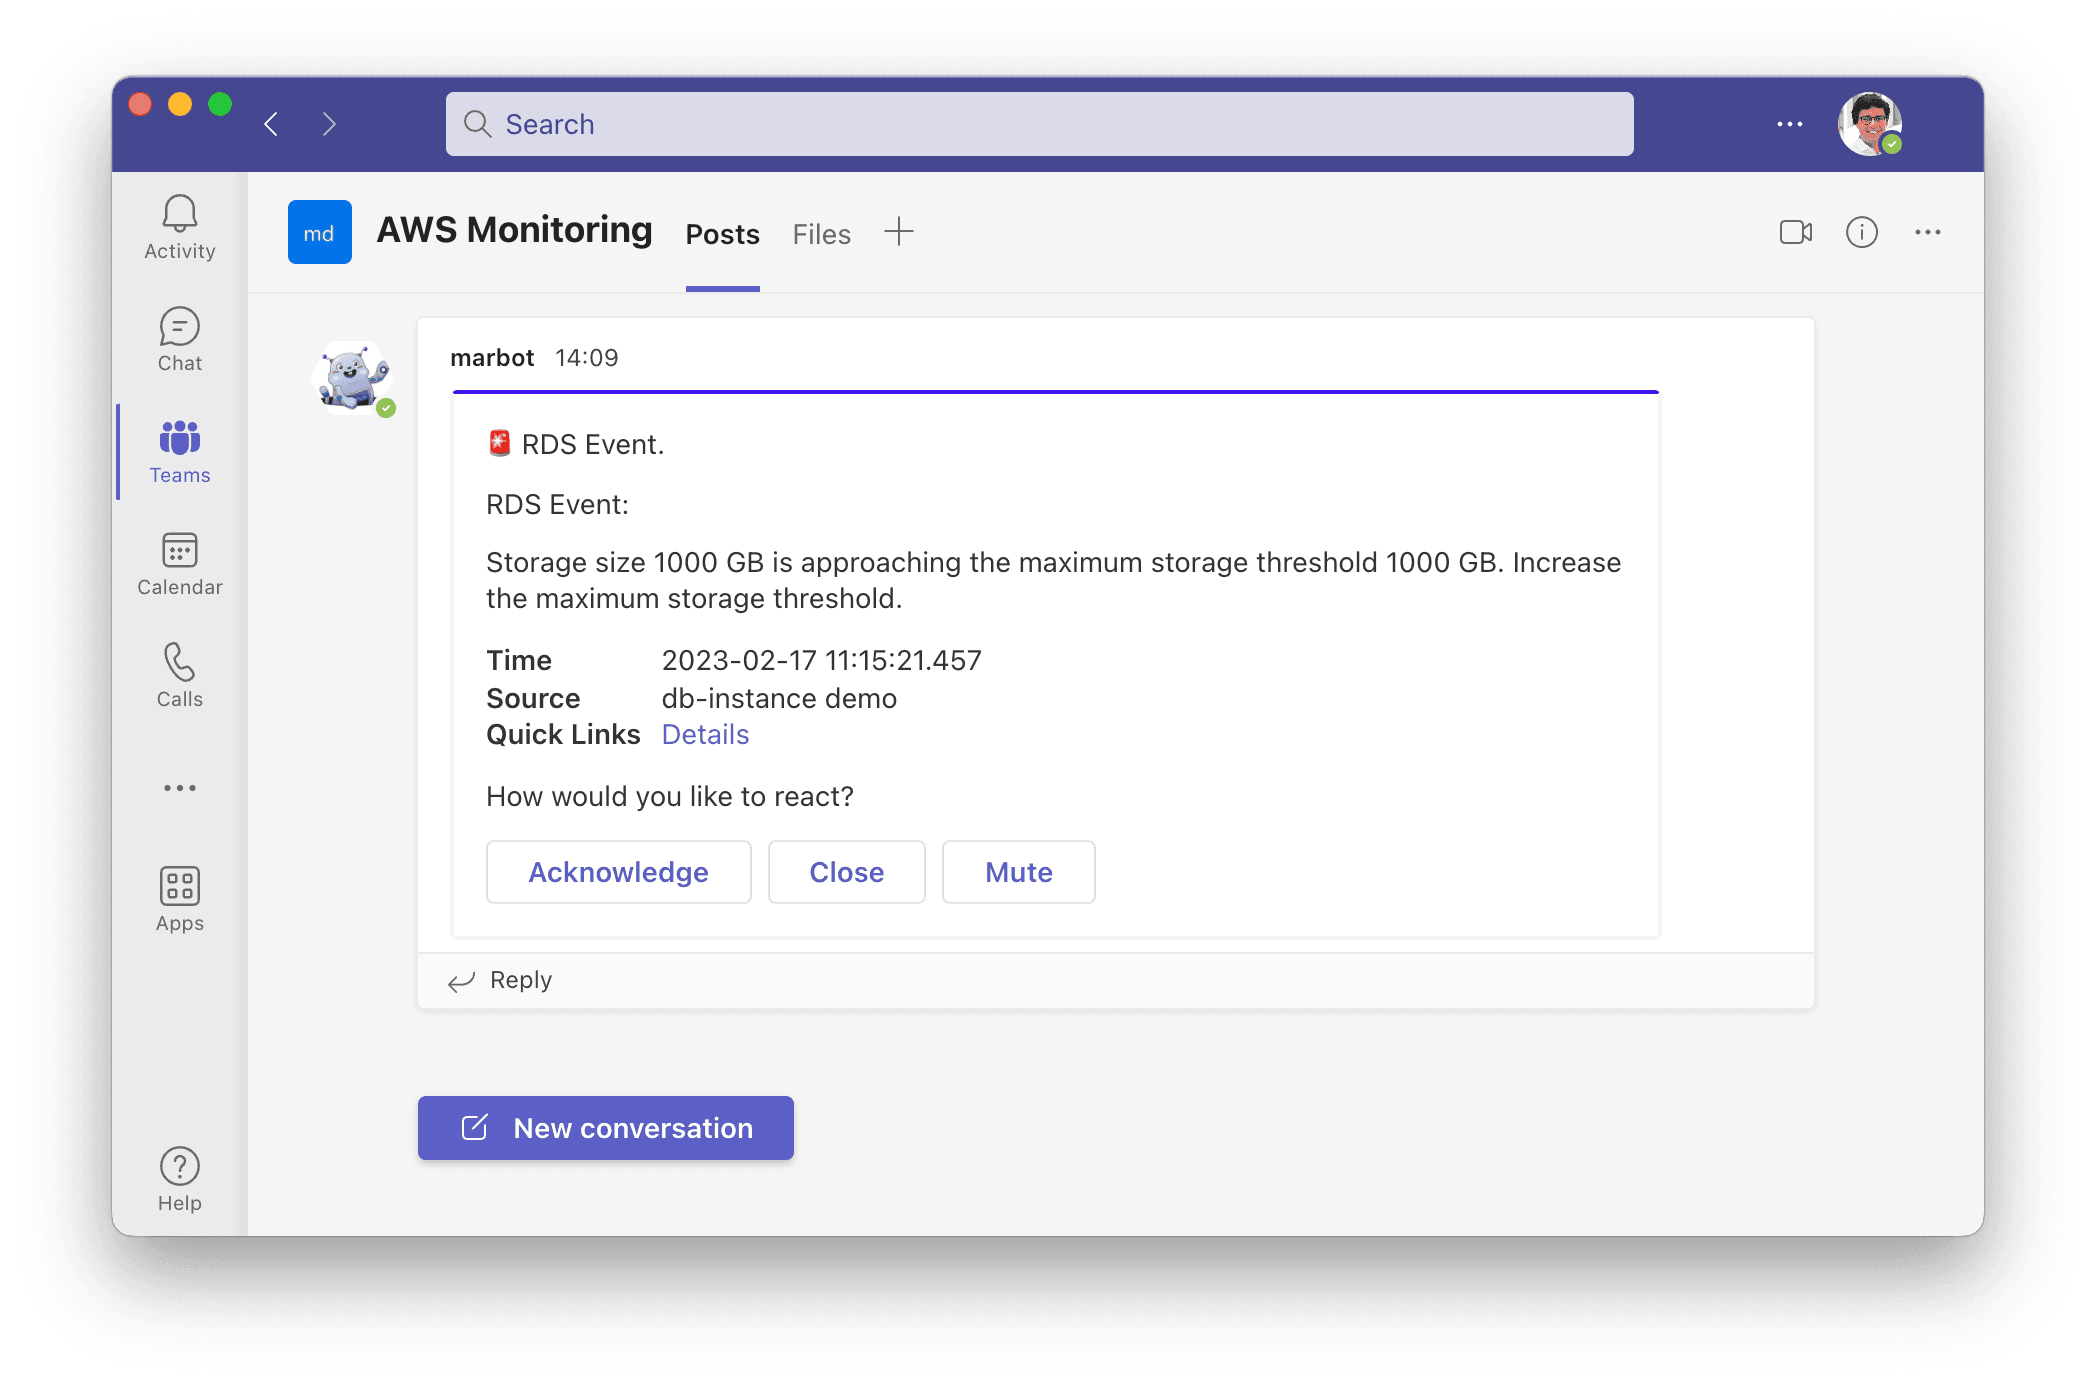
Without further ado, marbot monitors Amazon RDS. Here is what a notification delivered to a Microsoft Teams channel looks like.
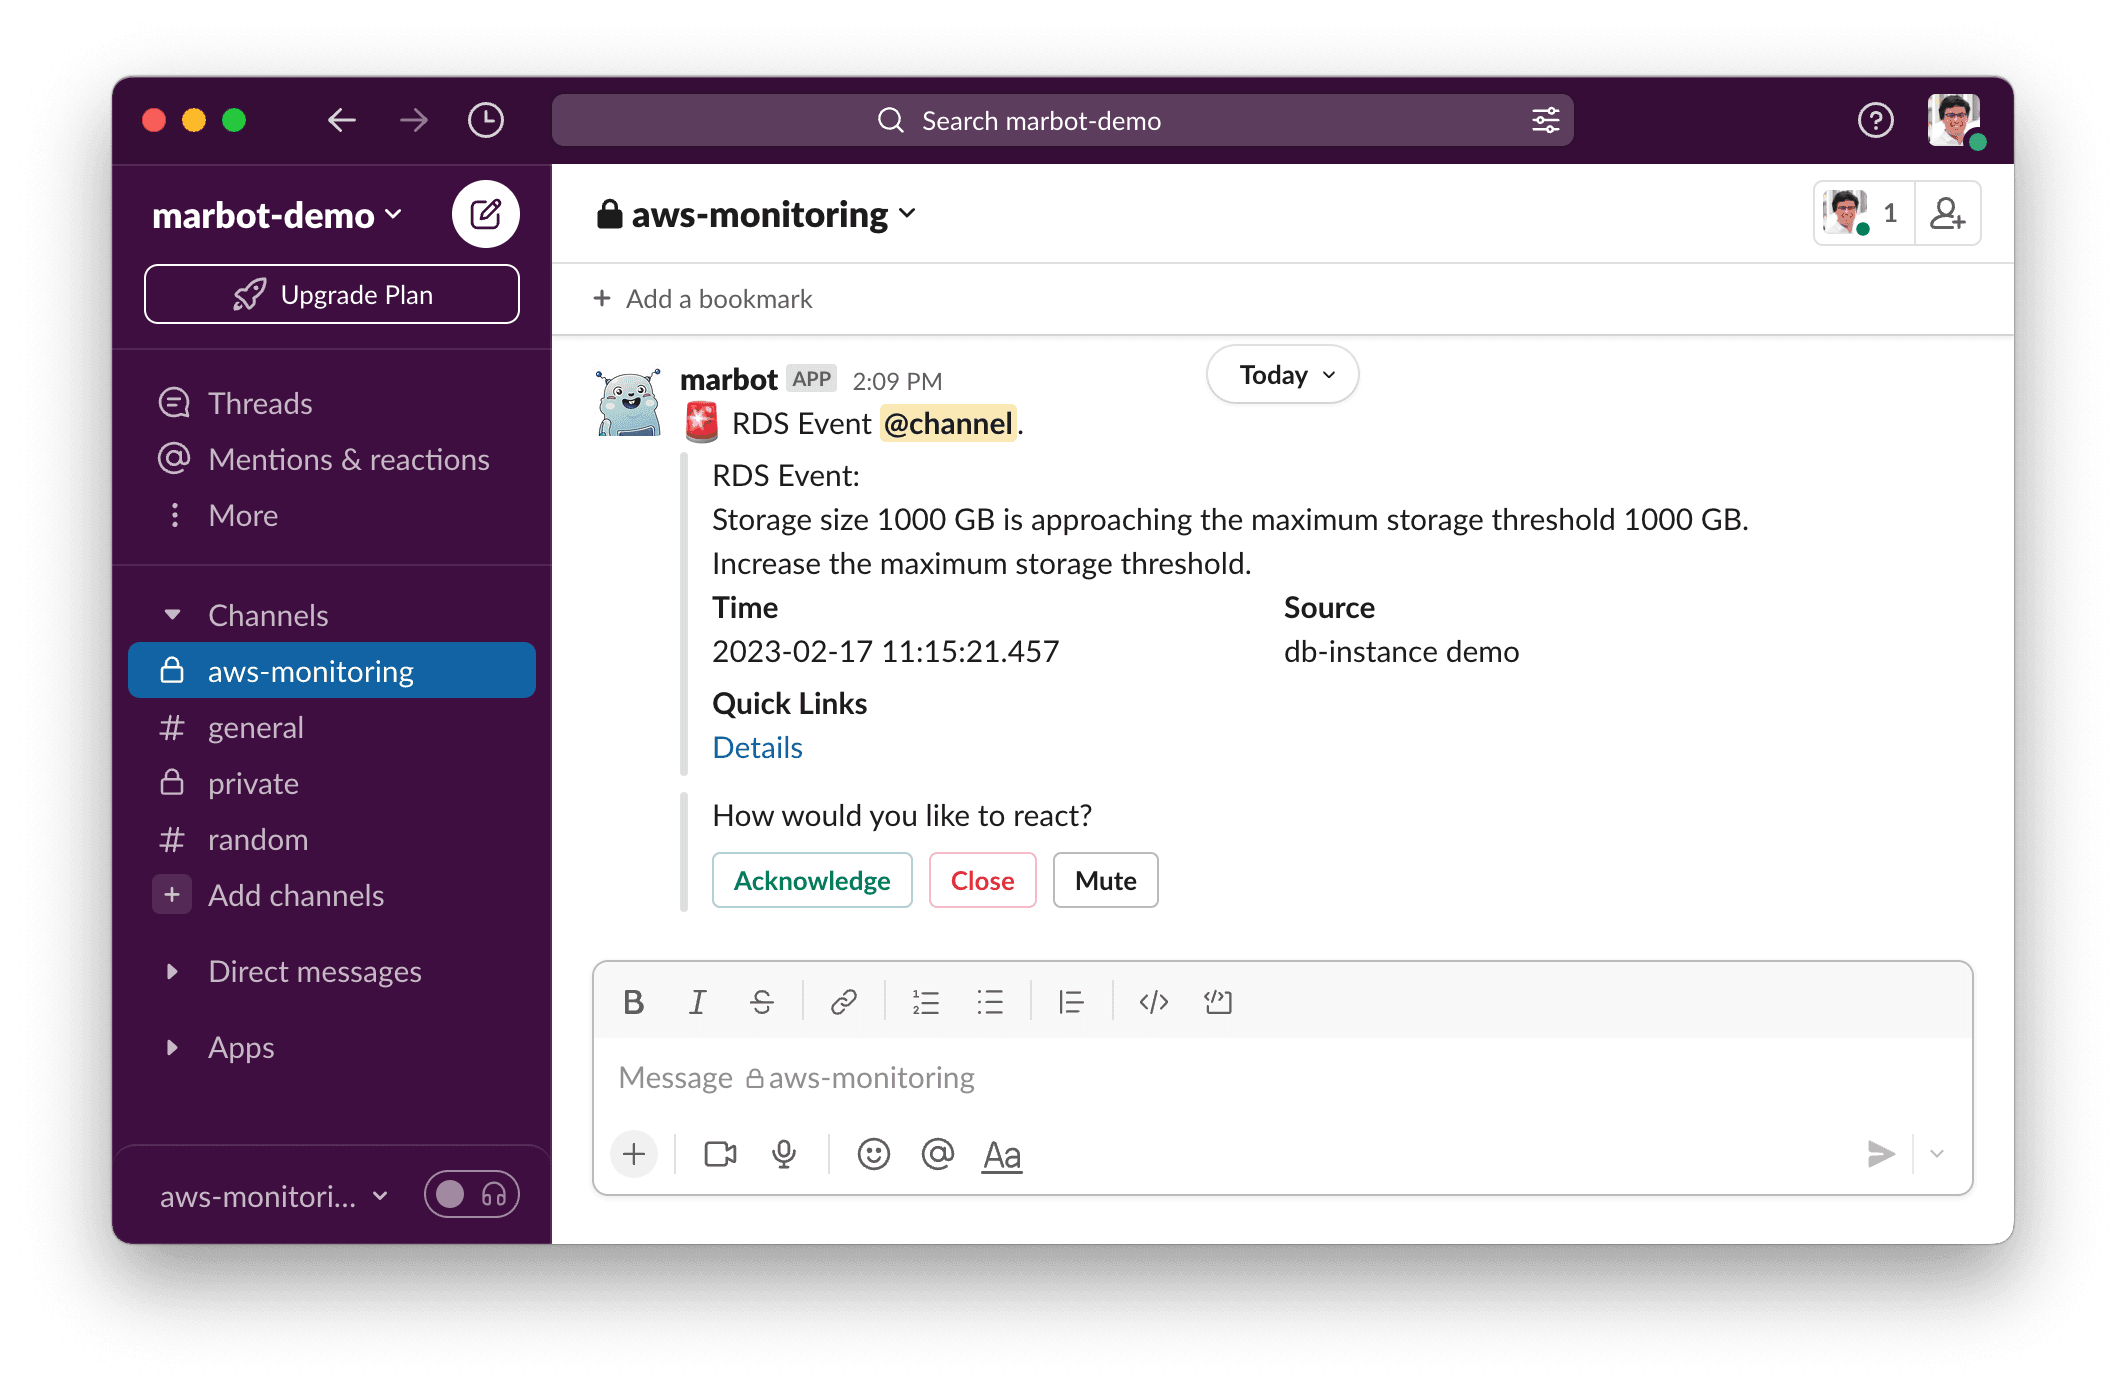
And here is the same alert in Slack.
How do you set up monitoring of Amazon RDS?
marbot works with Slack and Microsoft Teams. Please select your platform and follow the Getting Started guide.
Which metrics and events does marbot monitor in detail?
marbot creates CloudWatch alarms to automatically monitor the following metrics of all RDS clusters.
| Metric | Description |
|---|---|
CPUUtilization |
Get alerted if an RDS cluster is under high load for significant periods. |
CPUCreditBalance |
Get alerted if a burstable RDS cluster is running out of CPU credits, resulting in a significant performance drop. |
FreeableMemory |
Get alerted if an RDS cluster is running out of memory. |
marbot also creates an RDS event subscription for each RDS instance and cluster to monitor configuration changes, failover, failure, low storage, maintenance, recovery, and many more events.
How to fine-tune the monitoring of RDS clusters?
It is possible to fine-tune the CloudWatch alarms created by marbot by adding tags to your RDS cluster.
Tags are read every six hours. Therefore, it can take up to six hours before the CloudWatch alarm is adjusted.
| tag key | default value | allowed values |
|---|---|---|
marbot |
on | on,off |
marbot:cpu-utilization |
static | static,off |
marbot:cpu-utilization:threshold |
80 | 0-100 |
marbot:cpu-utilization:period |
600 | <= 86400 and multiple of 60 |
marbot:cpu-utilization:evaluation-periods |
1 | >= 1 and $period*$evaluation-periods <= 86400 |
marbot:cpu-credit-balance |
static | static,off |
marbot:cpu-credit-balance:threshold |
20 | >= 0 |
marbot:cpu-credit-balance:period |
600 | <= 86400 and multiple of 60 |
marbot:cpu-credit-balance:evaluation-periods |
1 | >= 1 and $period*$evaluation-periods <= 86400 |
marbot:freeable-memory |
static | static,off |
marbot:freeable-memory:threshold |
64000000 | >= 0 |
marbot:freeable-memory:period |
600 | <= 86400 and multiple of 60 |
marbot:freeable-memory:evaluation-periods |
1 | >= 1 and $period*$evaluation-periods <= 86400 |

Chatbot for AWS Monitoring
Configure monitoring for Amazon Web Services: CloudWatch, EC2, RDS, EB, Lambda, and more. Receive and manage alerts via Slack. Solve incidents as a team.