Monitoring EC2 disk usage with CloudWatch metrics and alarms
Andreas Wittig – 04 Aug 2020
About ten years ago, I broke my Linux laptop because I was modifying config files - /etc/passwd when I remember it correctly - while my disk was running out of space due to a data synchronization job. This has been a lesson for me. Monitoring disk usage is crucial, especially on production systems.

This blog post teaches you how to monitor the disk usage of an EC2 instance, including EBS volumes, as well as instance store.
Disk usage metric missing?
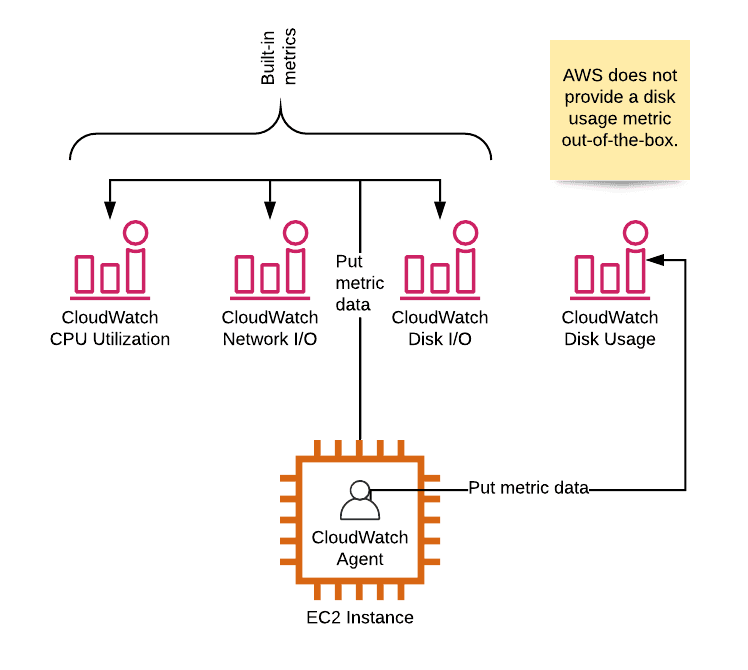
By default, AWS collects a bunch of CloudWatch metrics for every running EC2 instance.
CPUUtilizationDiskReadOpsandDiskWriteOpsDiskReadBytesandDiskWriteBytesNetworkInandNetworkOutNetworkPacketsInandNetworkPacketsOut
Check out List the available CloudWatch metrics for your instances for a complete listing.
However, a crucial metric is missing. You will not find metrics indicating the disk usage. The reason for that, AWS - or to be more precise, the hypervisor - does know nothing about the usage of the instance store or EBS volumes linked to your EC2 instance.
Luckily, there is a simple solution to that problem: the CloudWatch agent. After installing and configuring the CloudWatch agent on your EC2 instance, the agent will send metric data with the disk utilization to CloudWatch. The next step is to create a CloudWatch alarm to monitor the disk utilization metric.
Read on to learn how to monitor the disk usage of your EC2 instance!
Attach IAM role
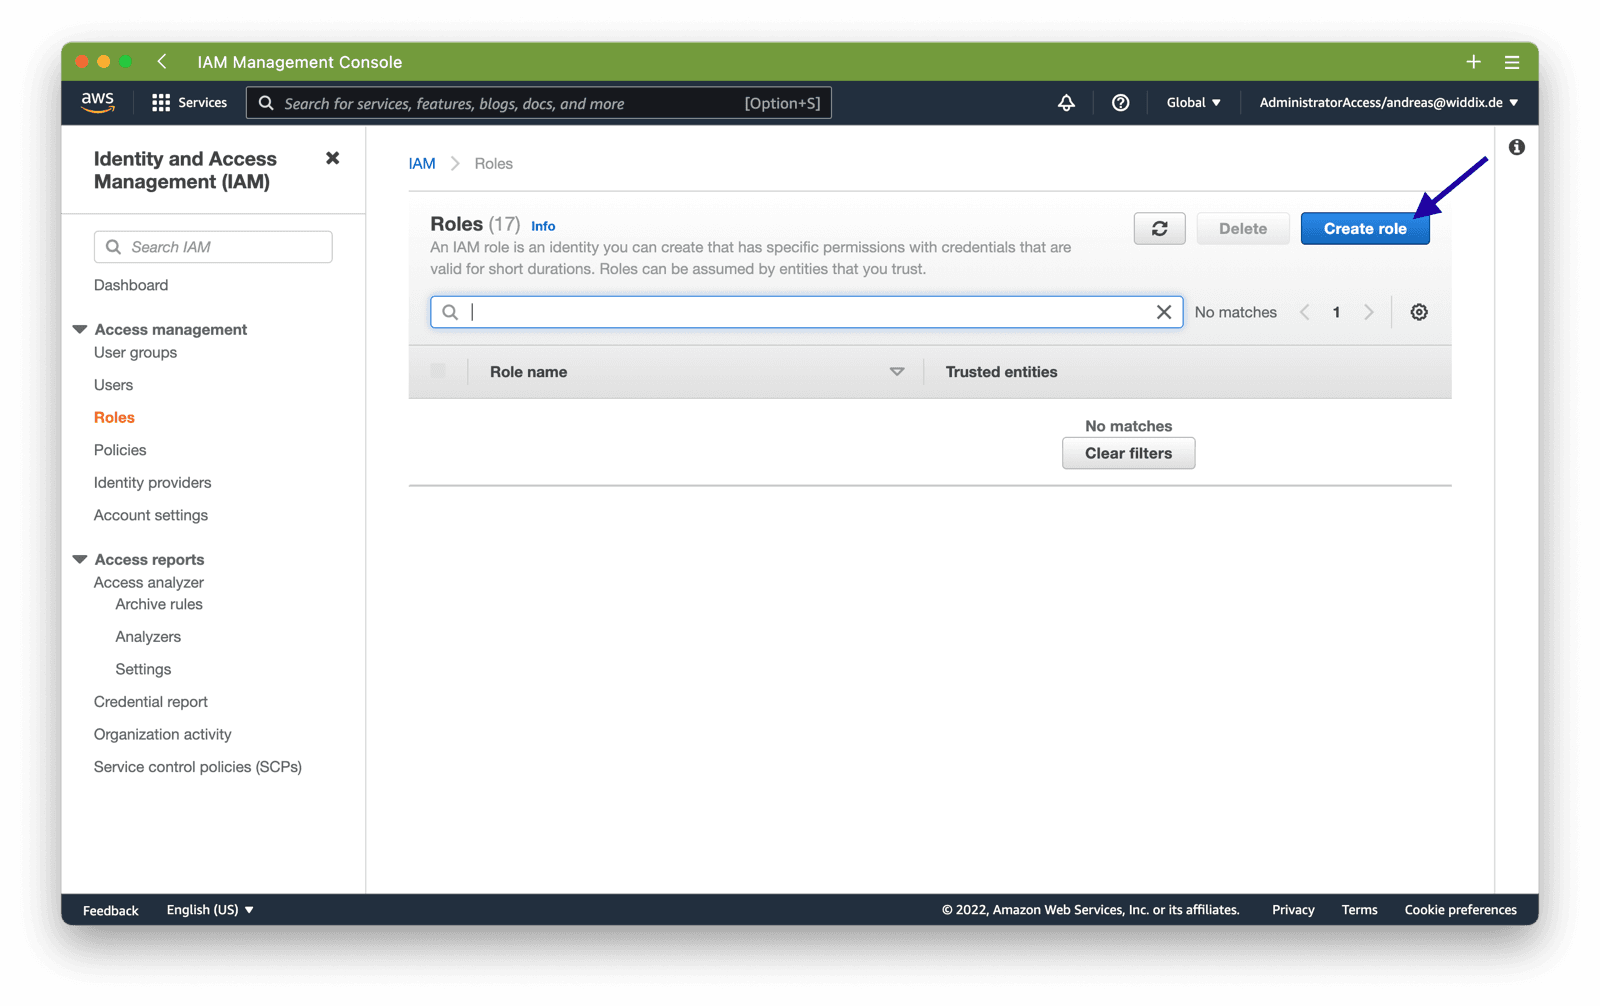
First, you need to grant the your EC2 access to the CloudWatch service.
To do so, open the AWS Management Console and go to the IAM service. Select Roles from the sub navigation and click the Create Role button.
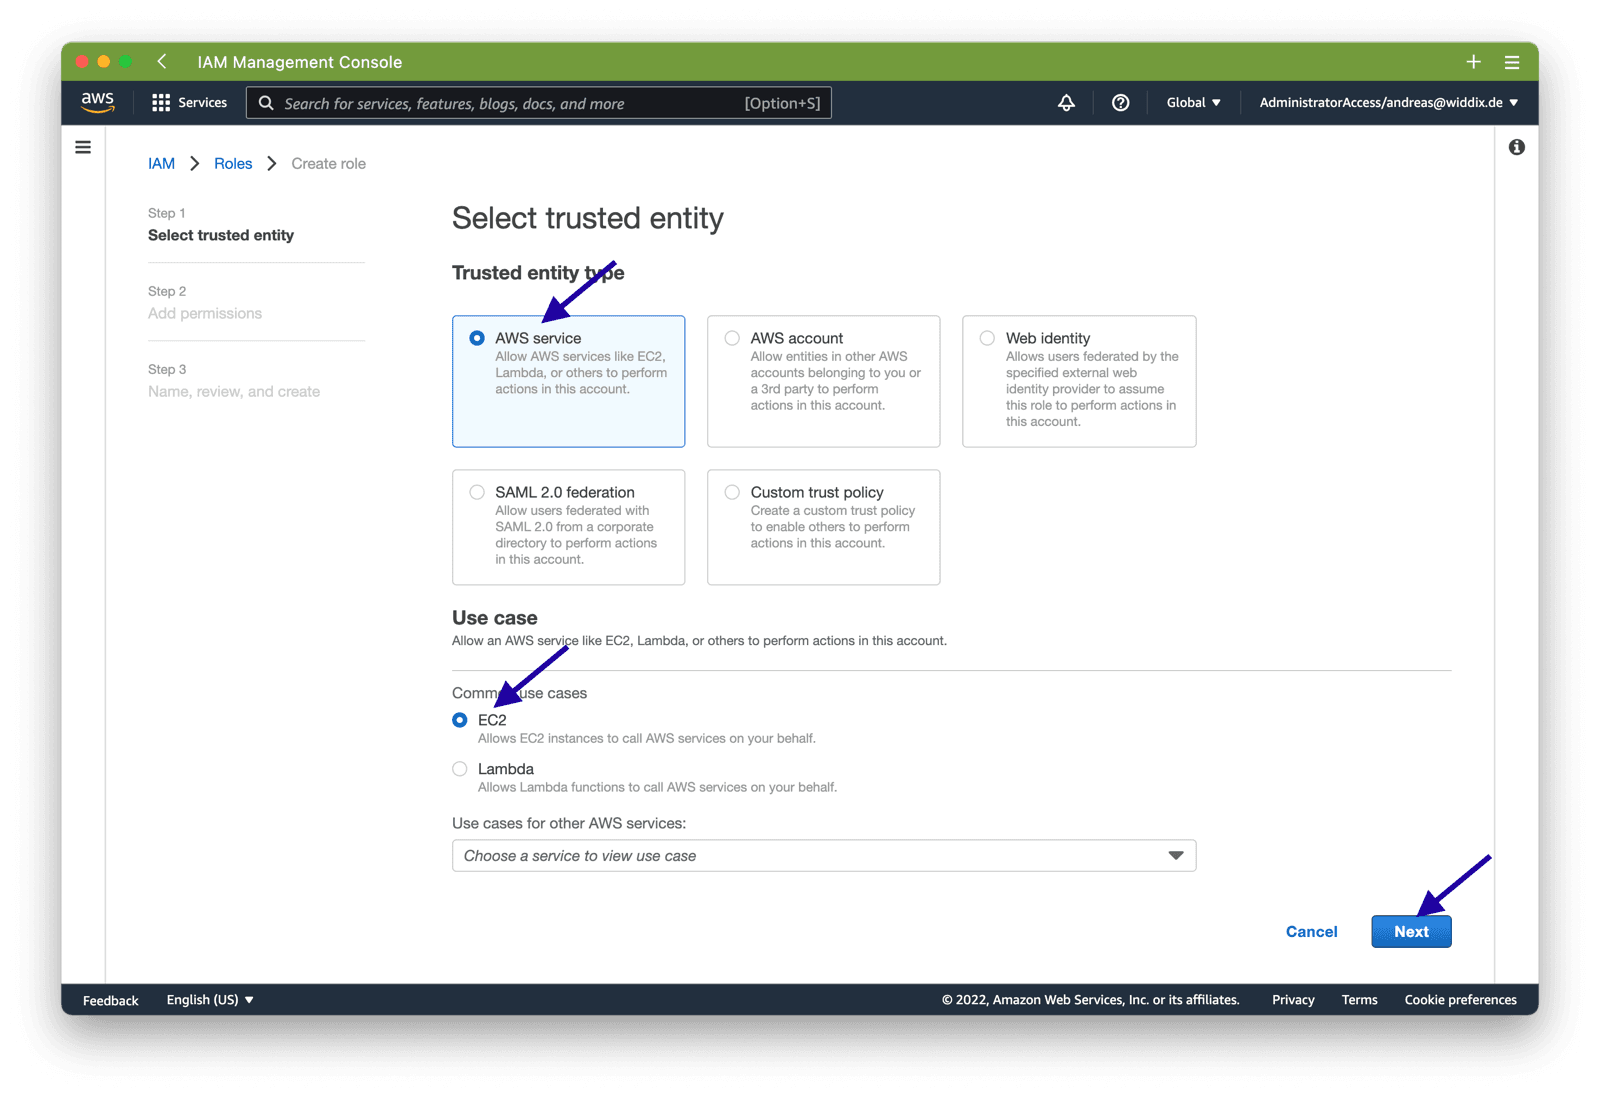
Next, choose AWS Servie and EC2 as the trusted entity for your IAM role and click Next.
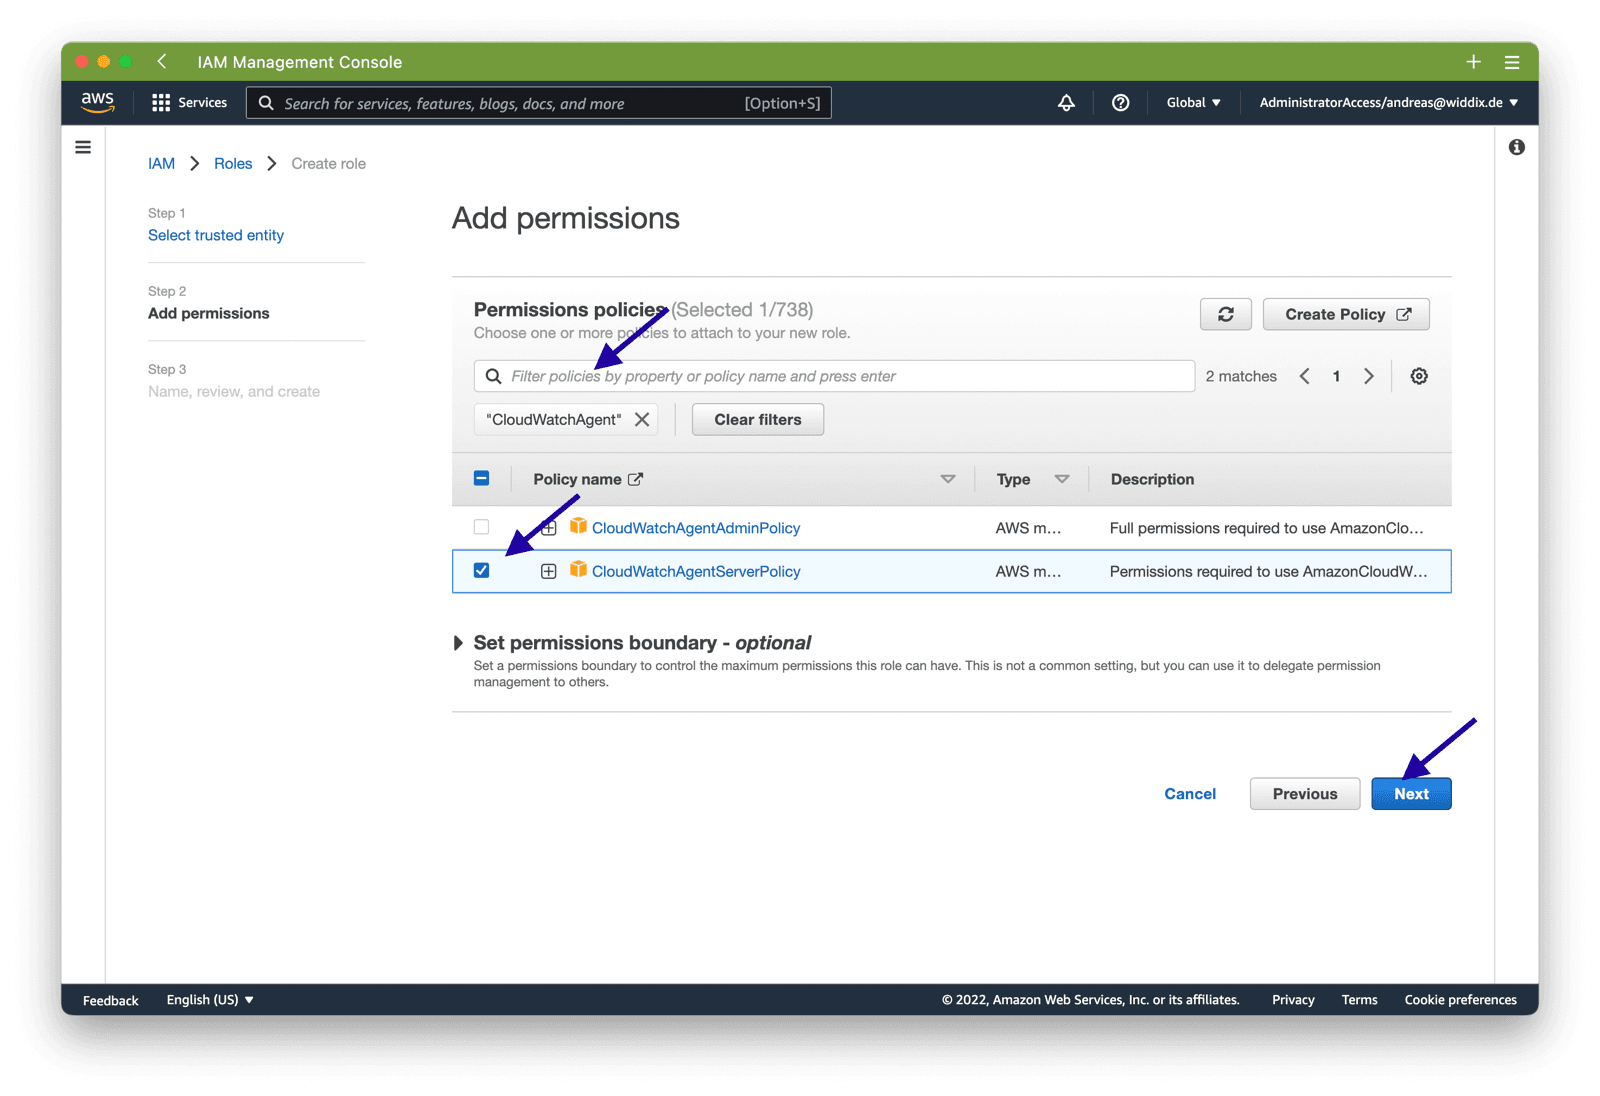
Now, you need to add permissions for CloudWatch. Search for CloudWatchAgent and select CloudWatchAgentServerPolicy from the result list. Click the Next button to proceed.
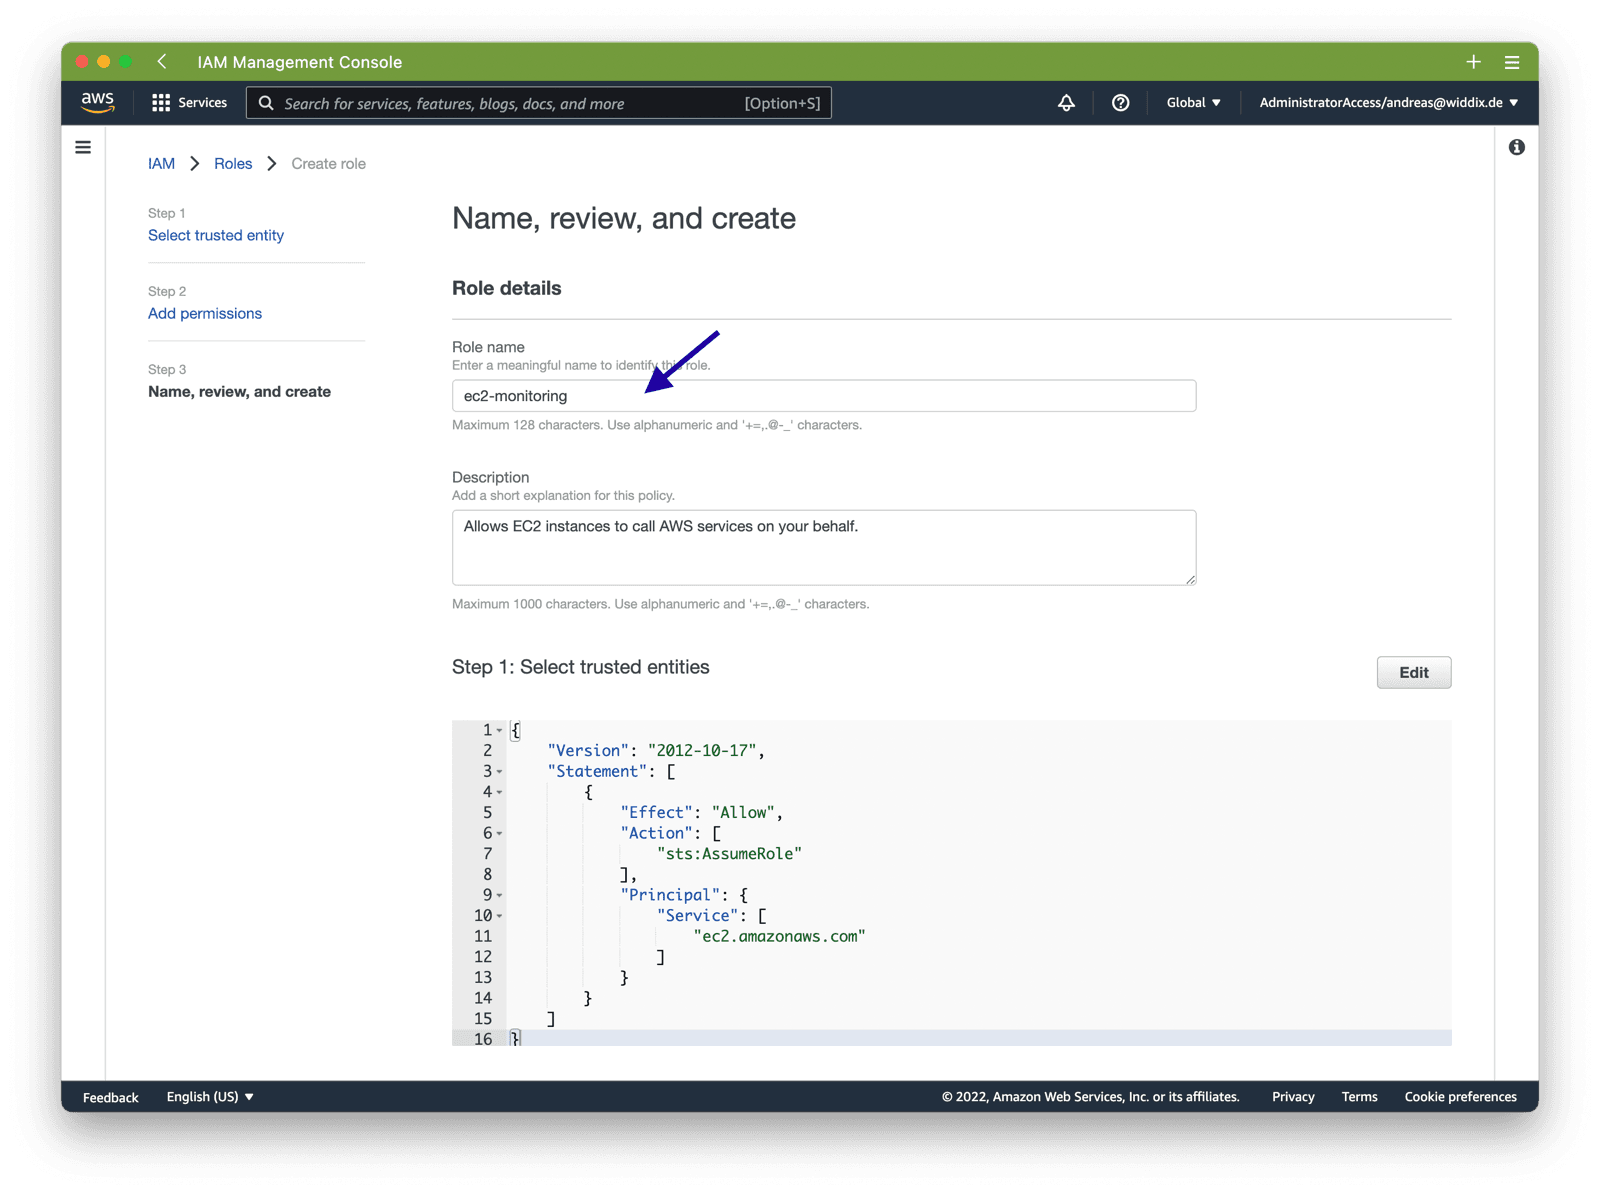
Type in a name for the IAM role. We are using ec2-monitoring for this example. But you are free tho choose your own name.
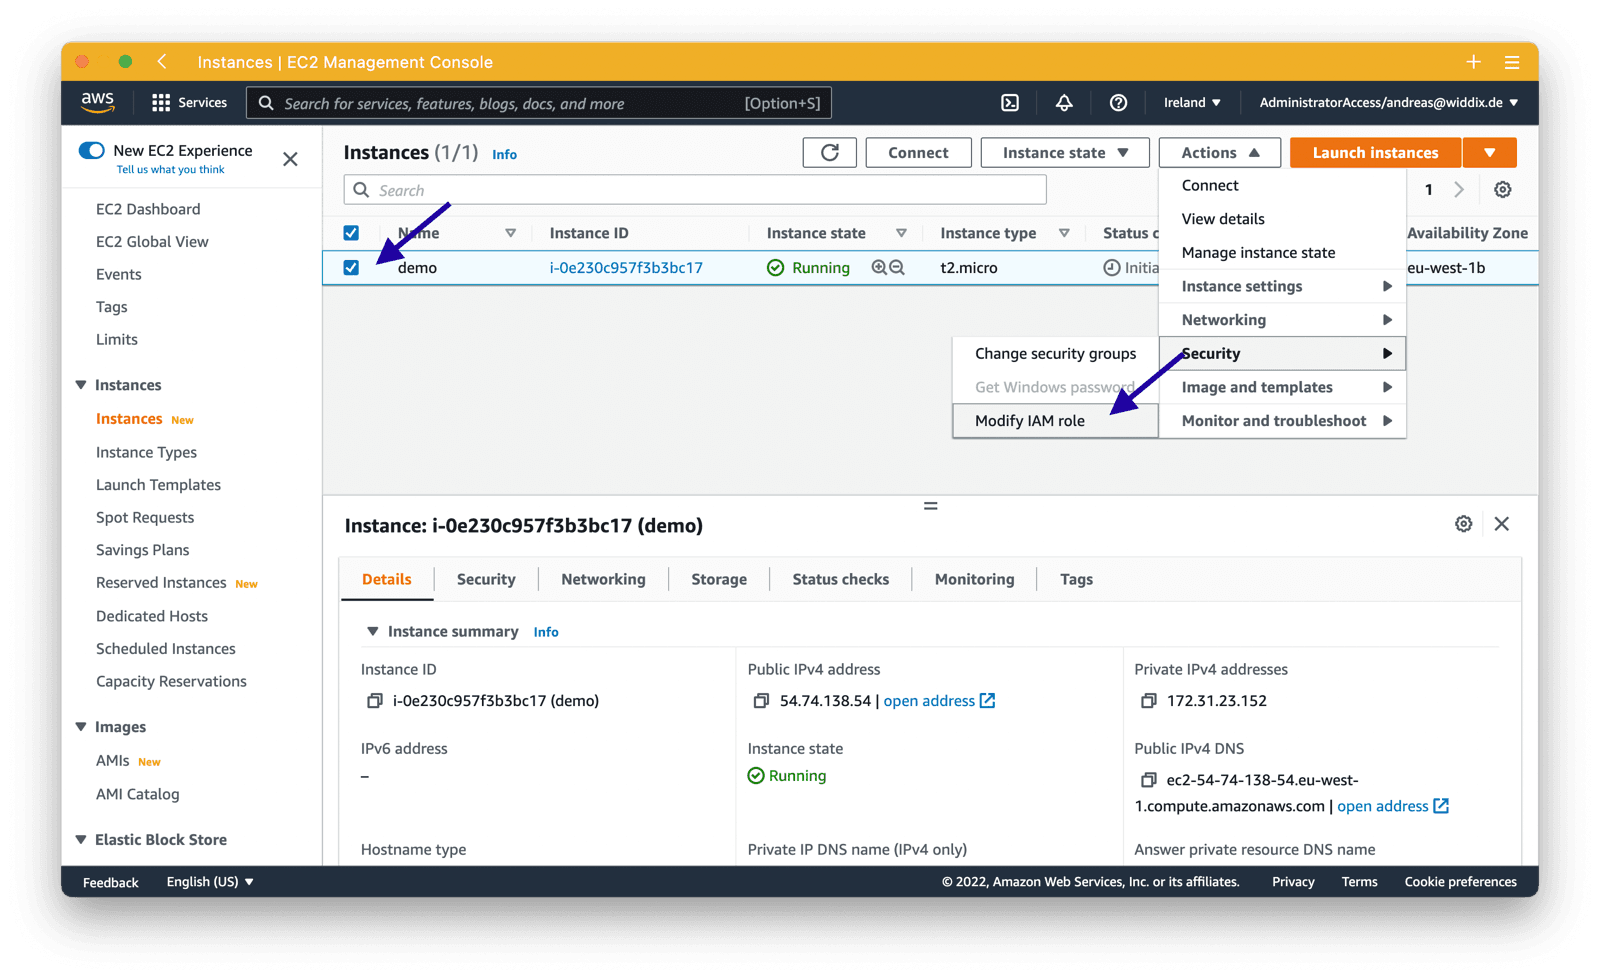
Next, open the EC2 service and select the EC2 instance you want to monitor. Click the Actions button and select Modify IAM role from the Security category.
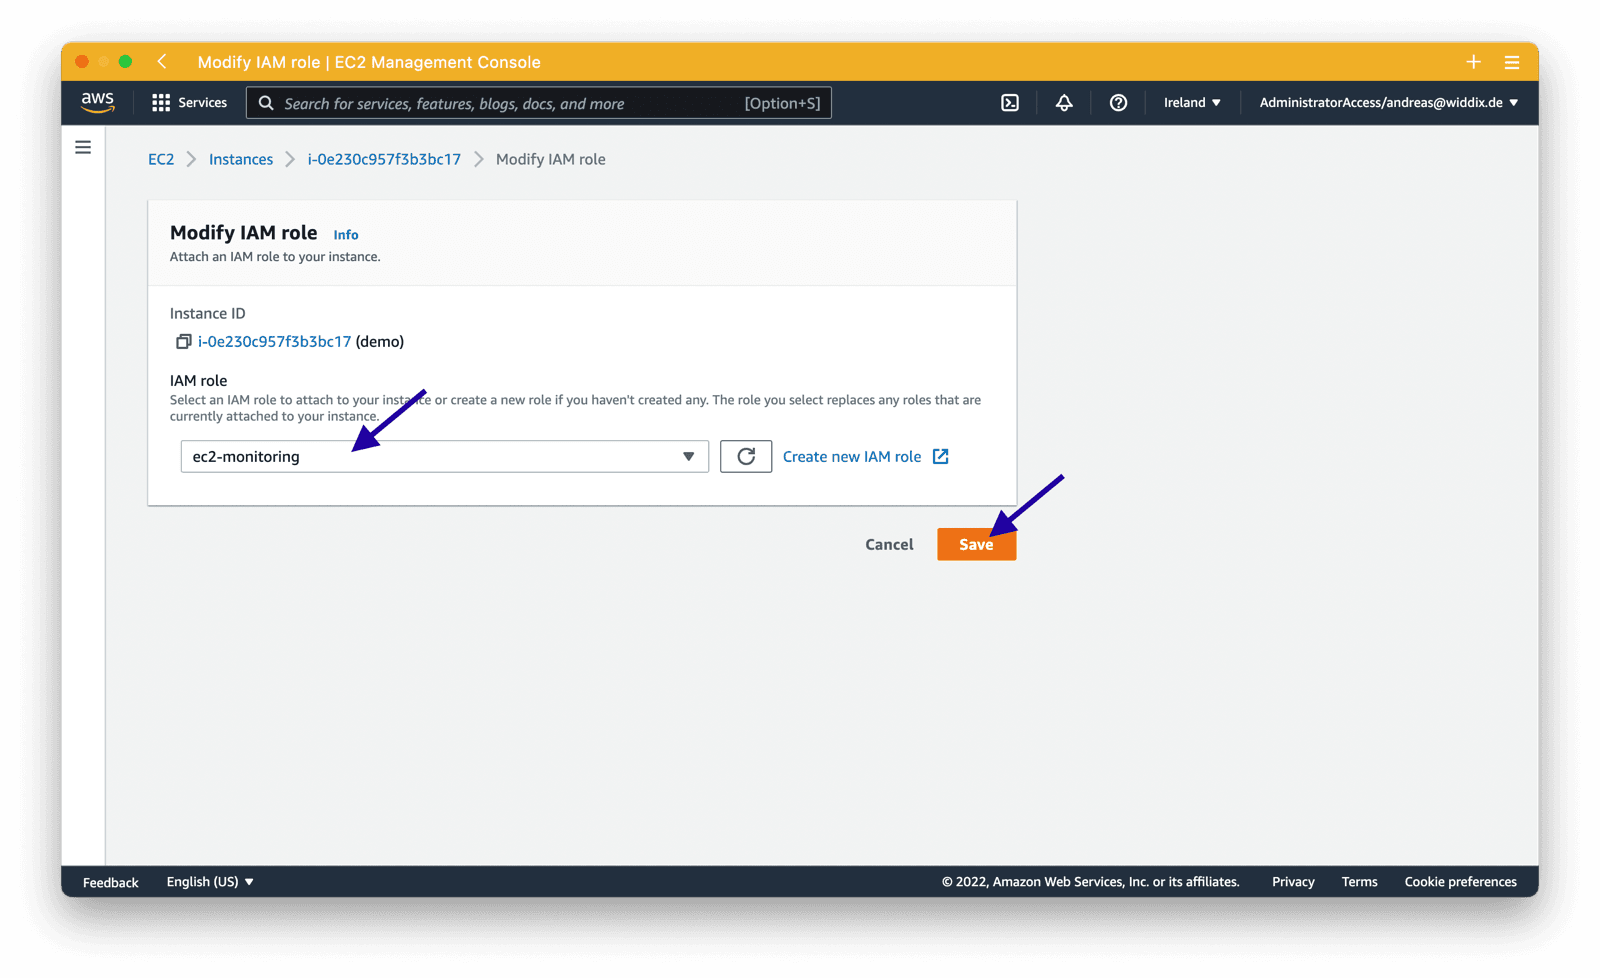
Choose the IAM role you just created, ec2-monitoring in our example and click the Save button.
Your EC2 instance is now allowed to send CloudWatch metrics. Next, you will learn how to install the CloudWatch agent.
Install CloudWatch agent
Next, use SSH or the Session Manager to connect with your EC2 instance. First of all, you need to download the CloudWatch agent.
cd /tmp |
Next, install the agent.
sudo rpm -U amazon-cloudwatch-agent.rpm |
Are you not using Amazon Linux? Check out Download and Configure the CloudWatch Agent Using the Command Line for more information.
Configure CloudWatch agent
The following instructions will guide you through the process of configuring the CloudWatch agent.
Open an editor to create or edit the agent’s config file.
sudo vi /opt/aws/amazon-cloudwatch-agent/etc/amazon-cloudwatch-agent.json |
Copy and paste the following configuration written in JSON. A few explanations:
metrics_collecteddefines the metrics that the agent will send to CloudWatch.- In this scenario, we are only sending the
used_percentmetric for adisk. - Please note that
resourcesallows you to select specific disks. In this scenario, only the root volume/is monitored. Add additional volumes by adding their mount point if needed.
Check out Manually Create or Edit the CloudWatch Agent Configuration File to learn more about the available configuration parameters.
{ |
After editing the configuration file, you should restart the agent and check the agent’s logs.
sudo systemctl restart amazon-cloudwatch-agent |
After a few minutes, a new metric will show up in CloudWatch. Learn how to create a CloudWatch alarm next.
Monitoring Assistant
Monitor EC2 instances and receive alerts in Slack or Microsoft Teams!It couldn't be easier!
- Add marbot to Slack or Microsoft Teams.
- Invite marbot to a channel.
- Follow the setup wizard.
Create CloudWatch alarm
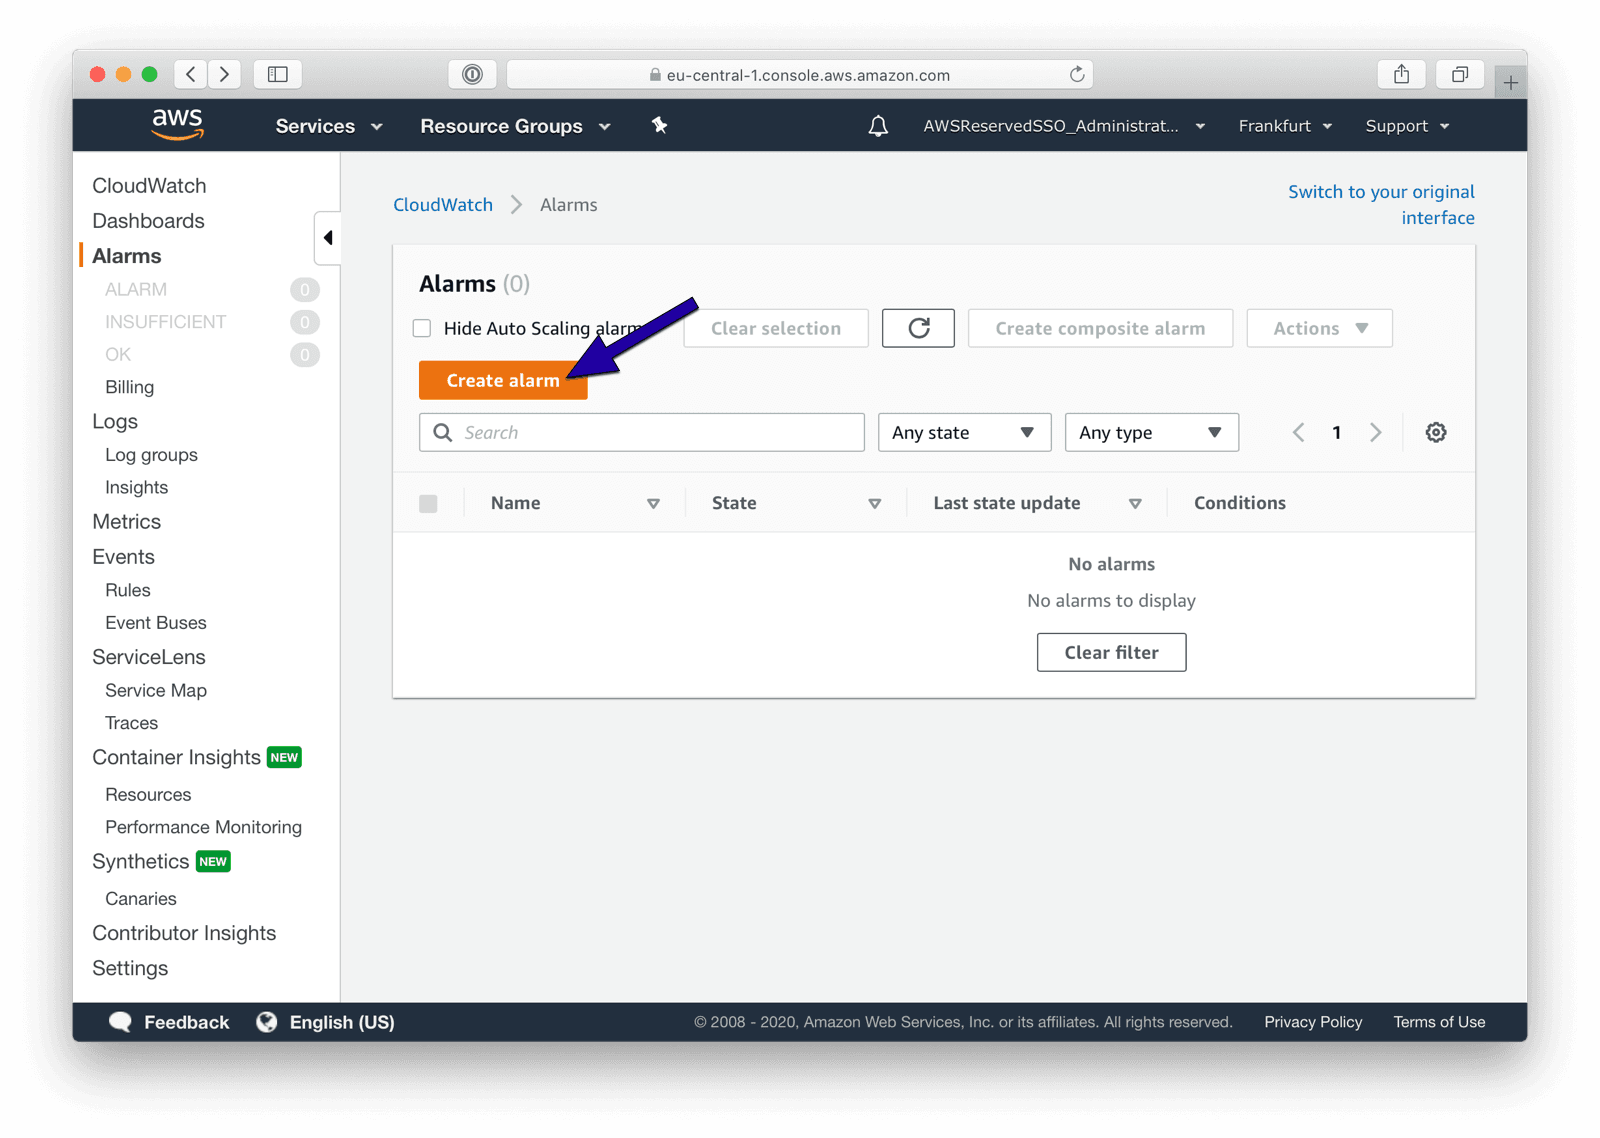
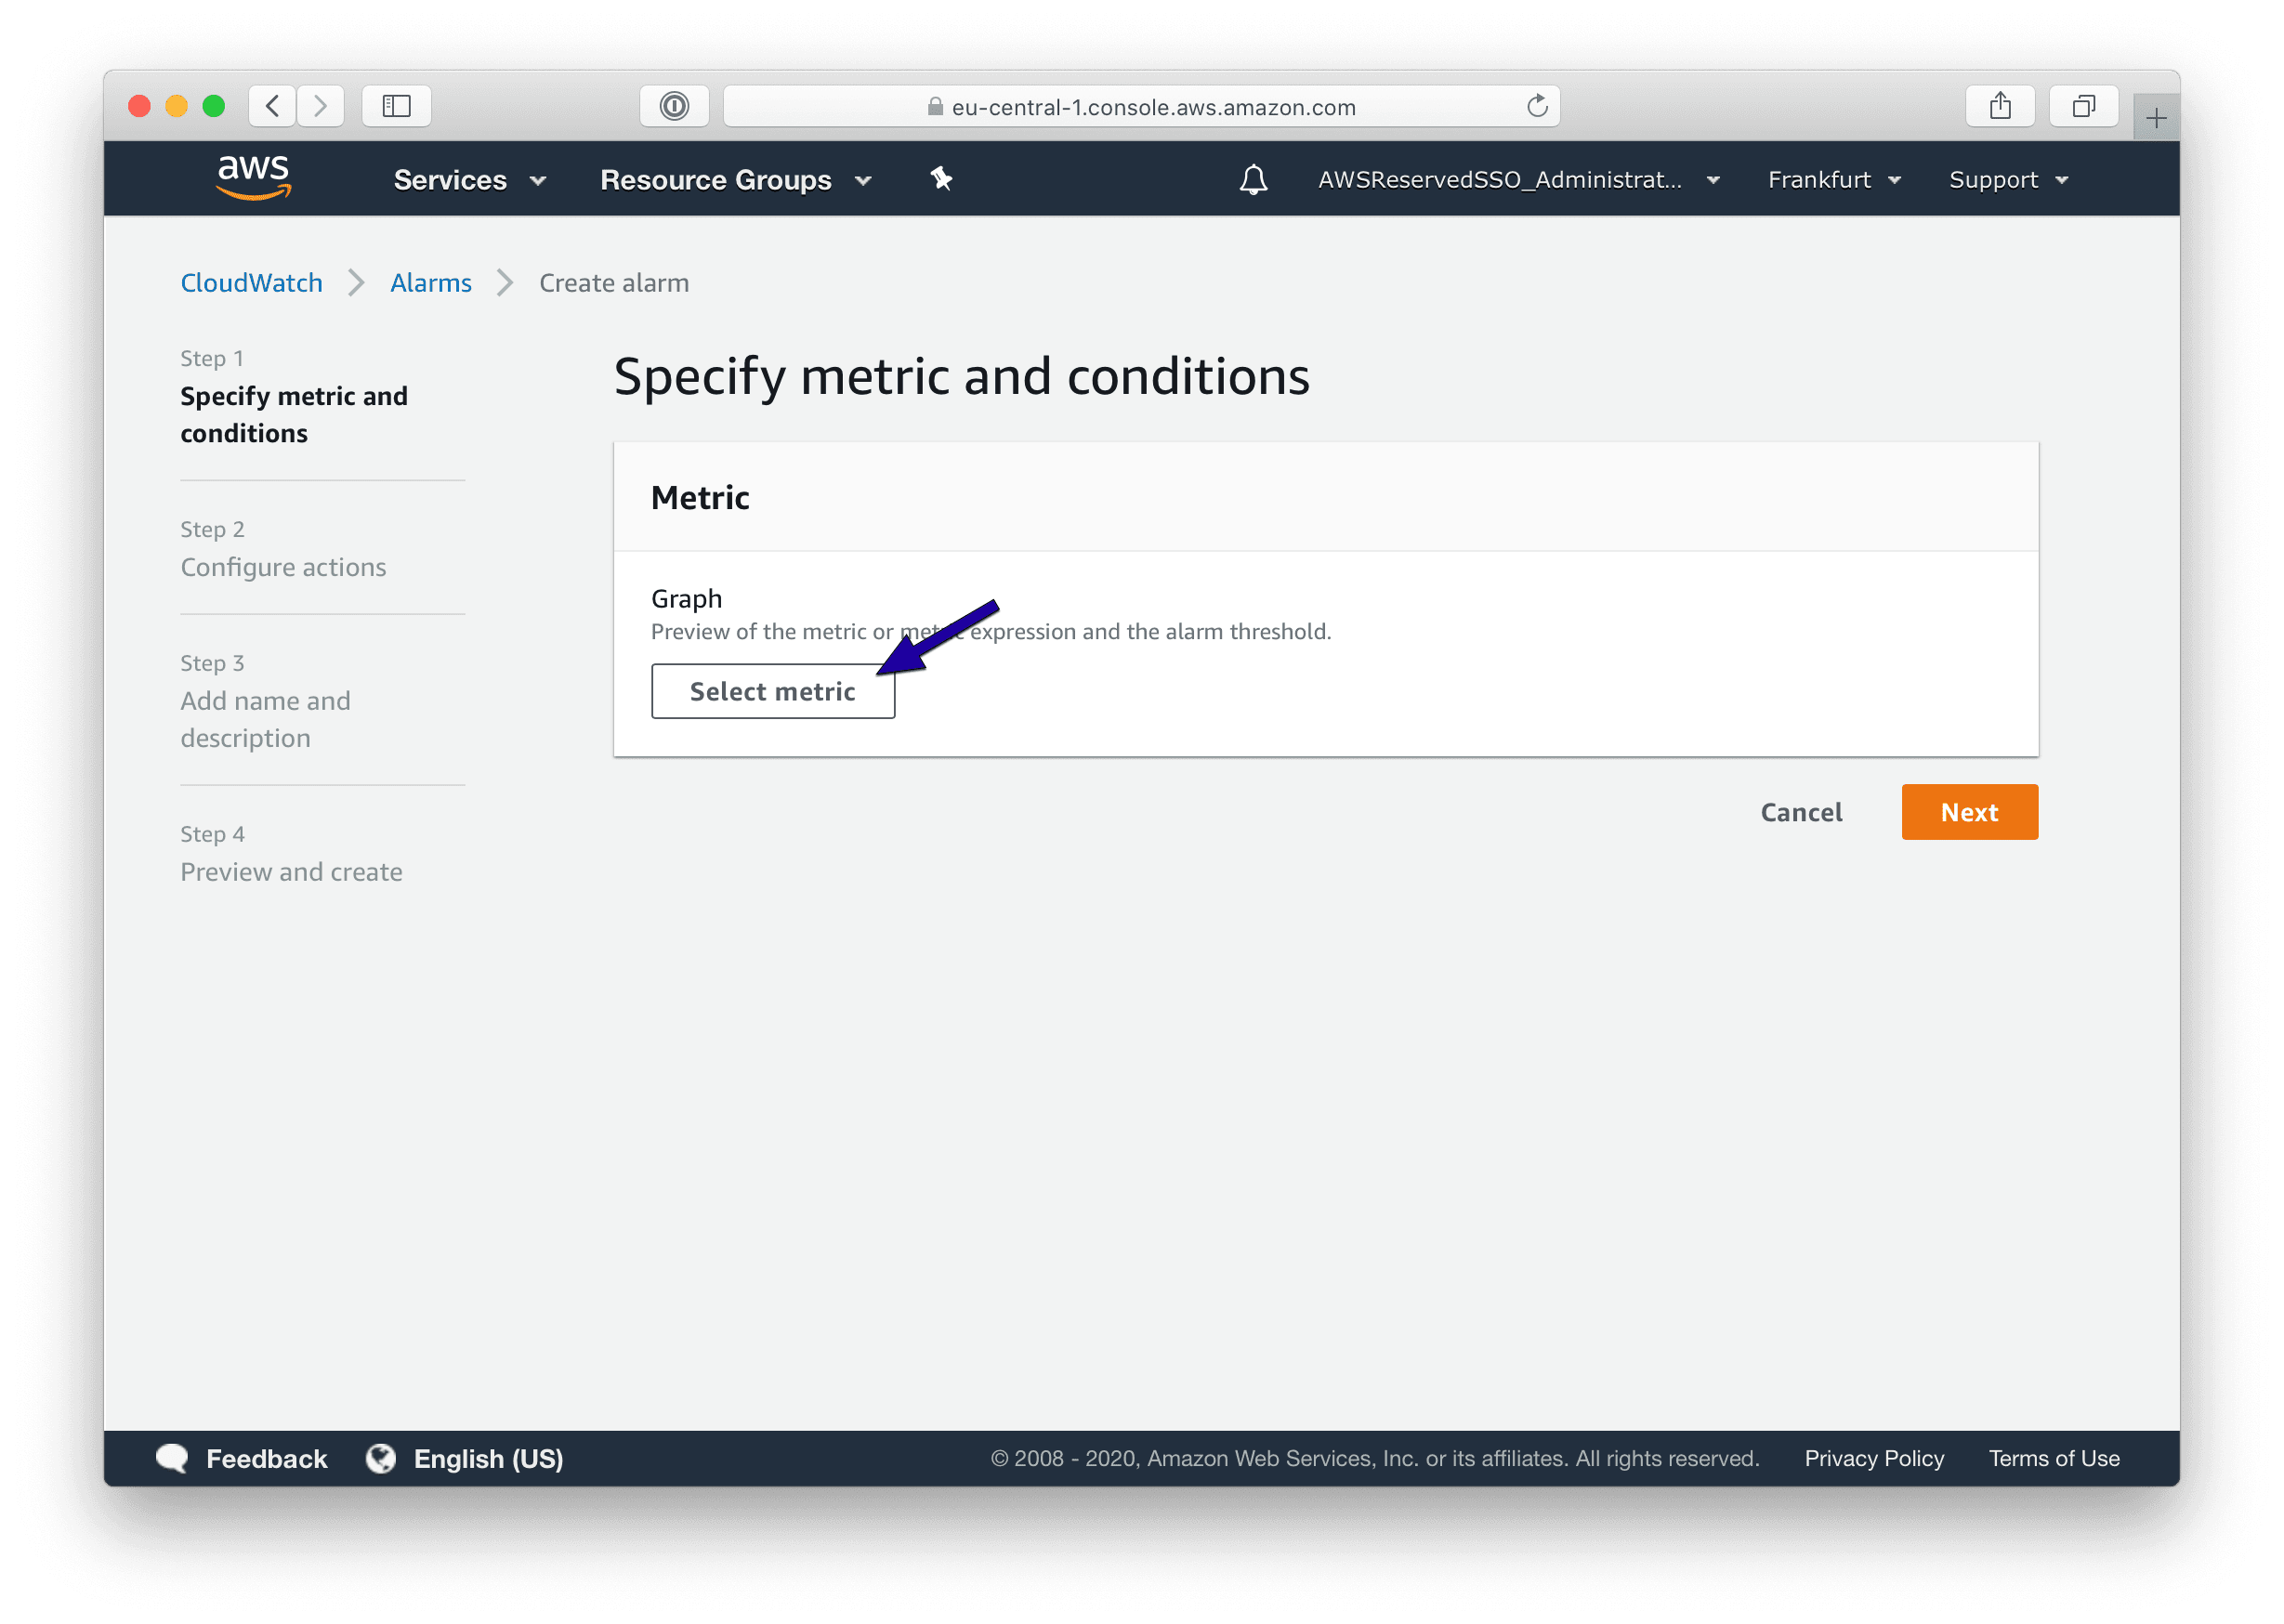
Open the AWS Management Console and switch to the CloudWatch service. Select Alarms from the sub-navigation and press the Create alarm button.
Click the Select metric button.
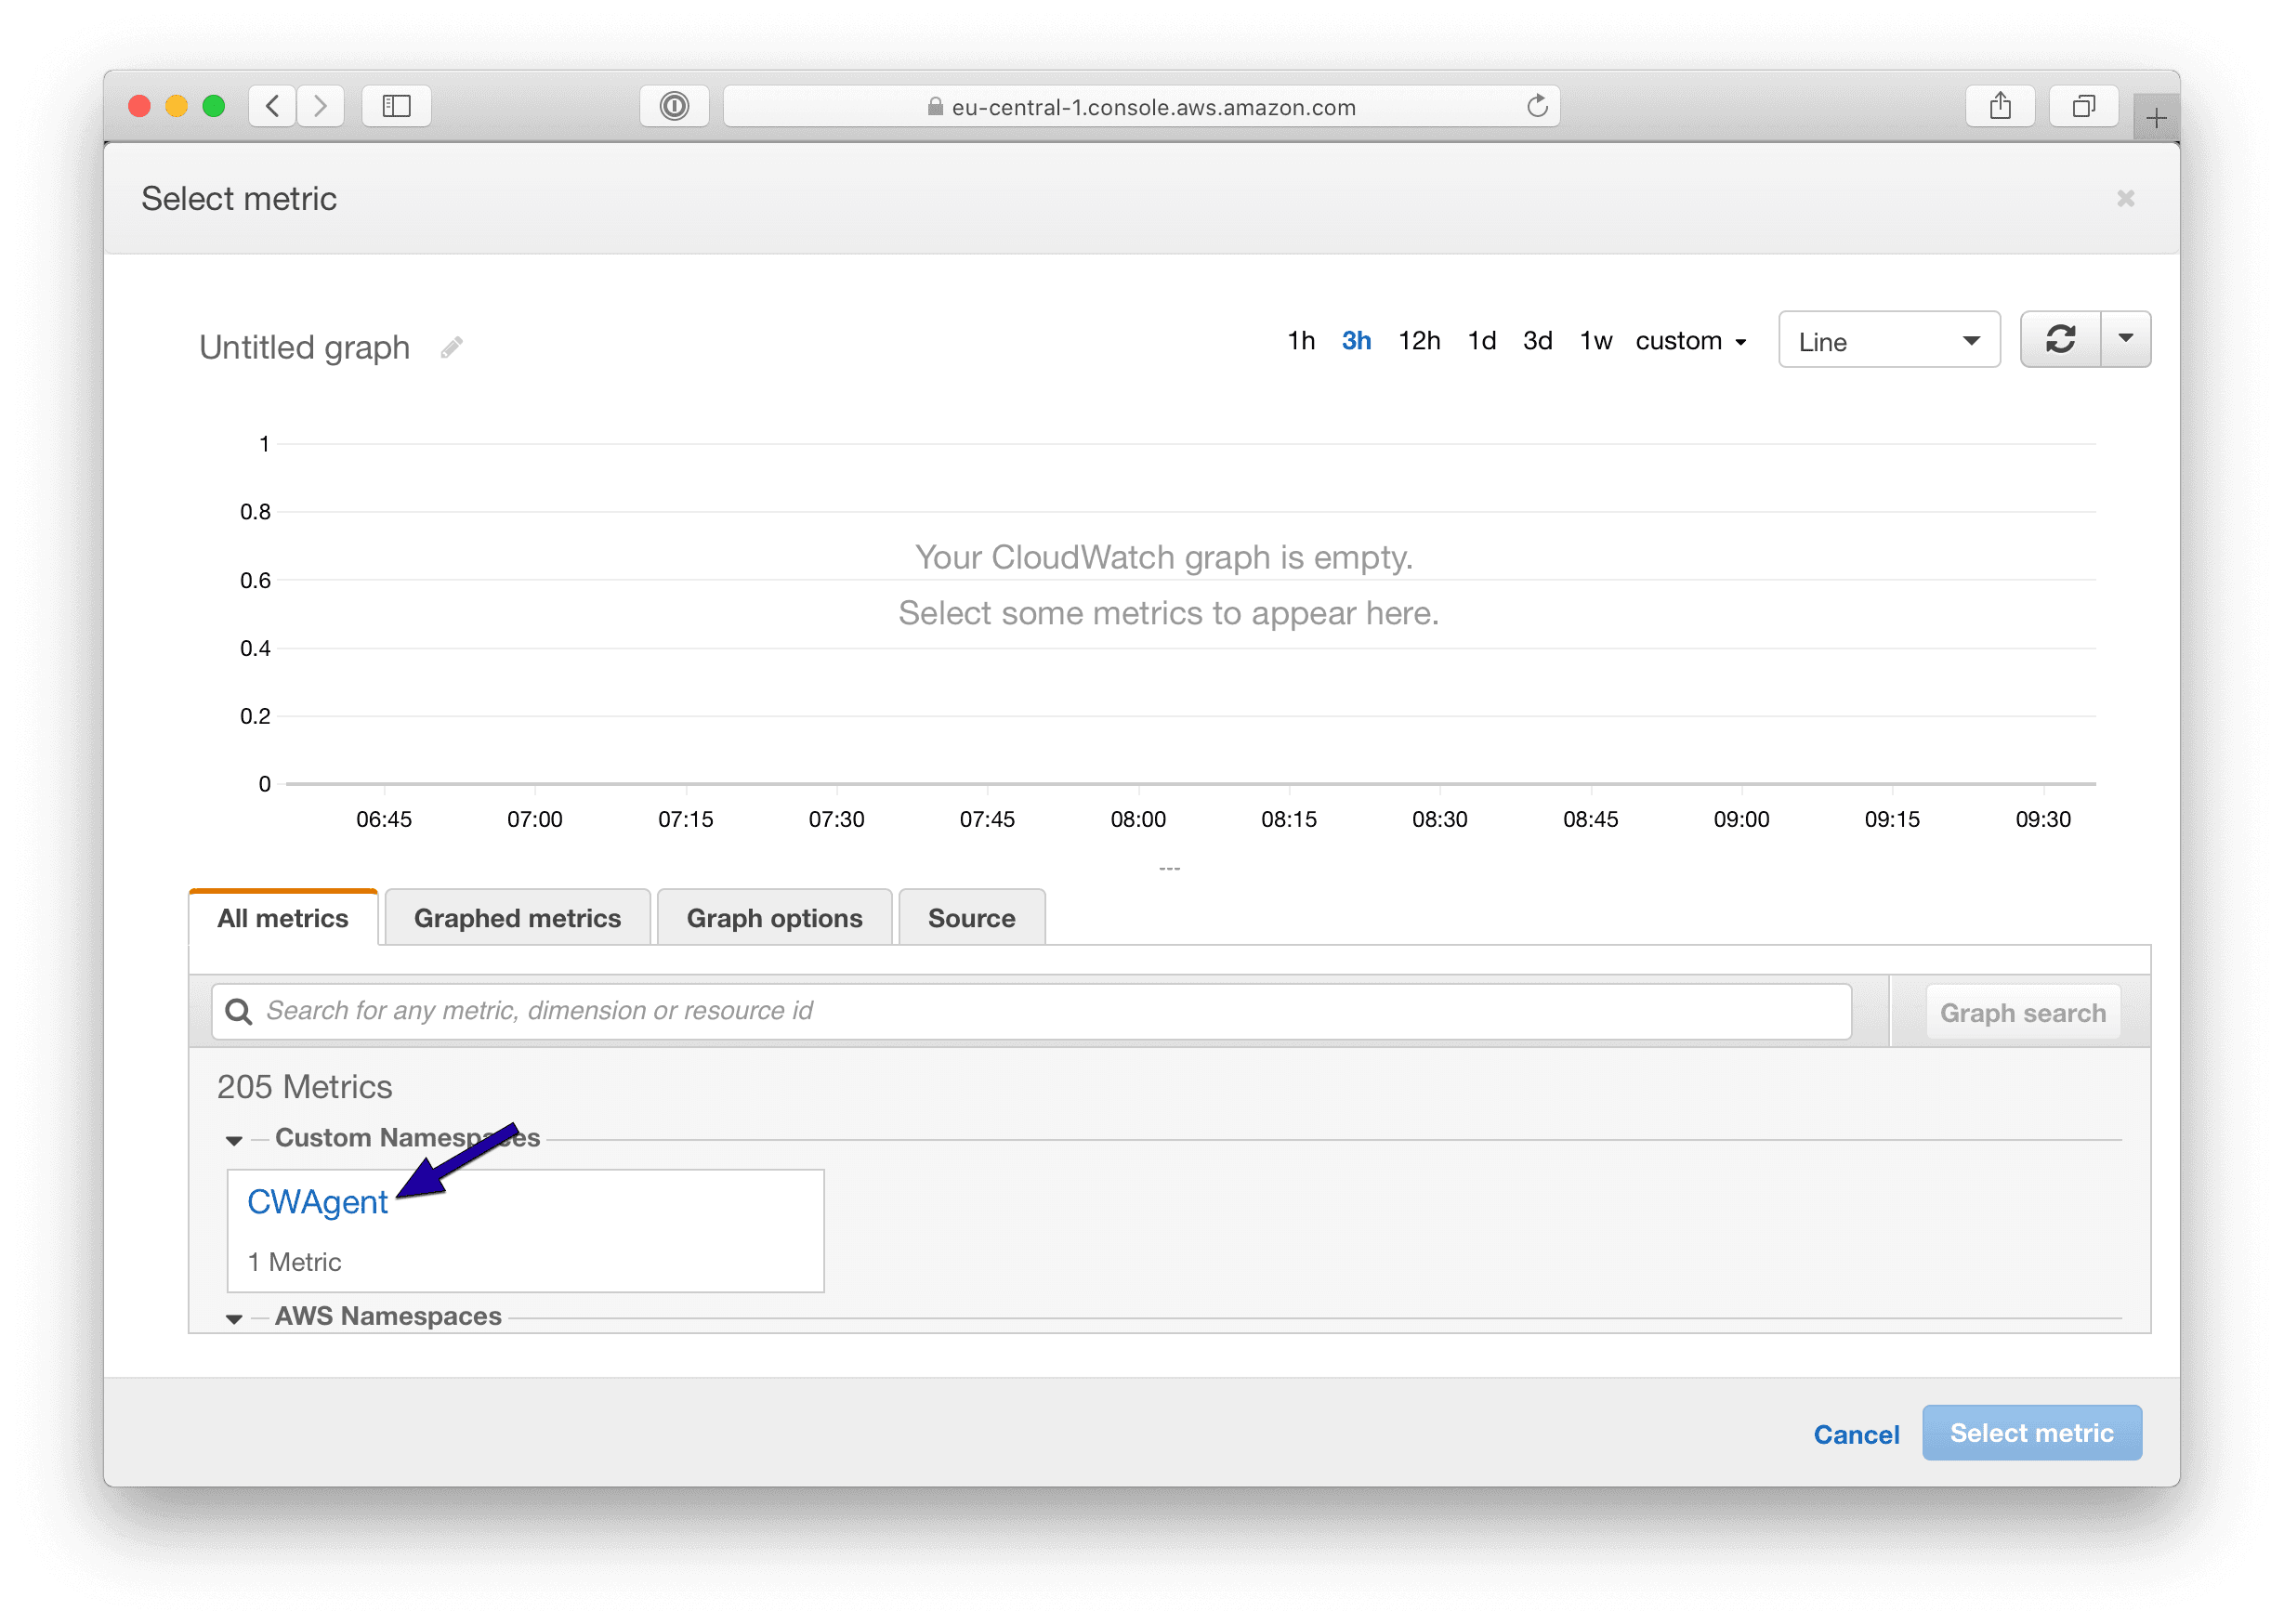
Search for the custom namespace CWAgent. Please note, it might take up to 5 minutes until new metrics and the custom namespace appear after starting the CloudWatch agent on an EC2 instance.
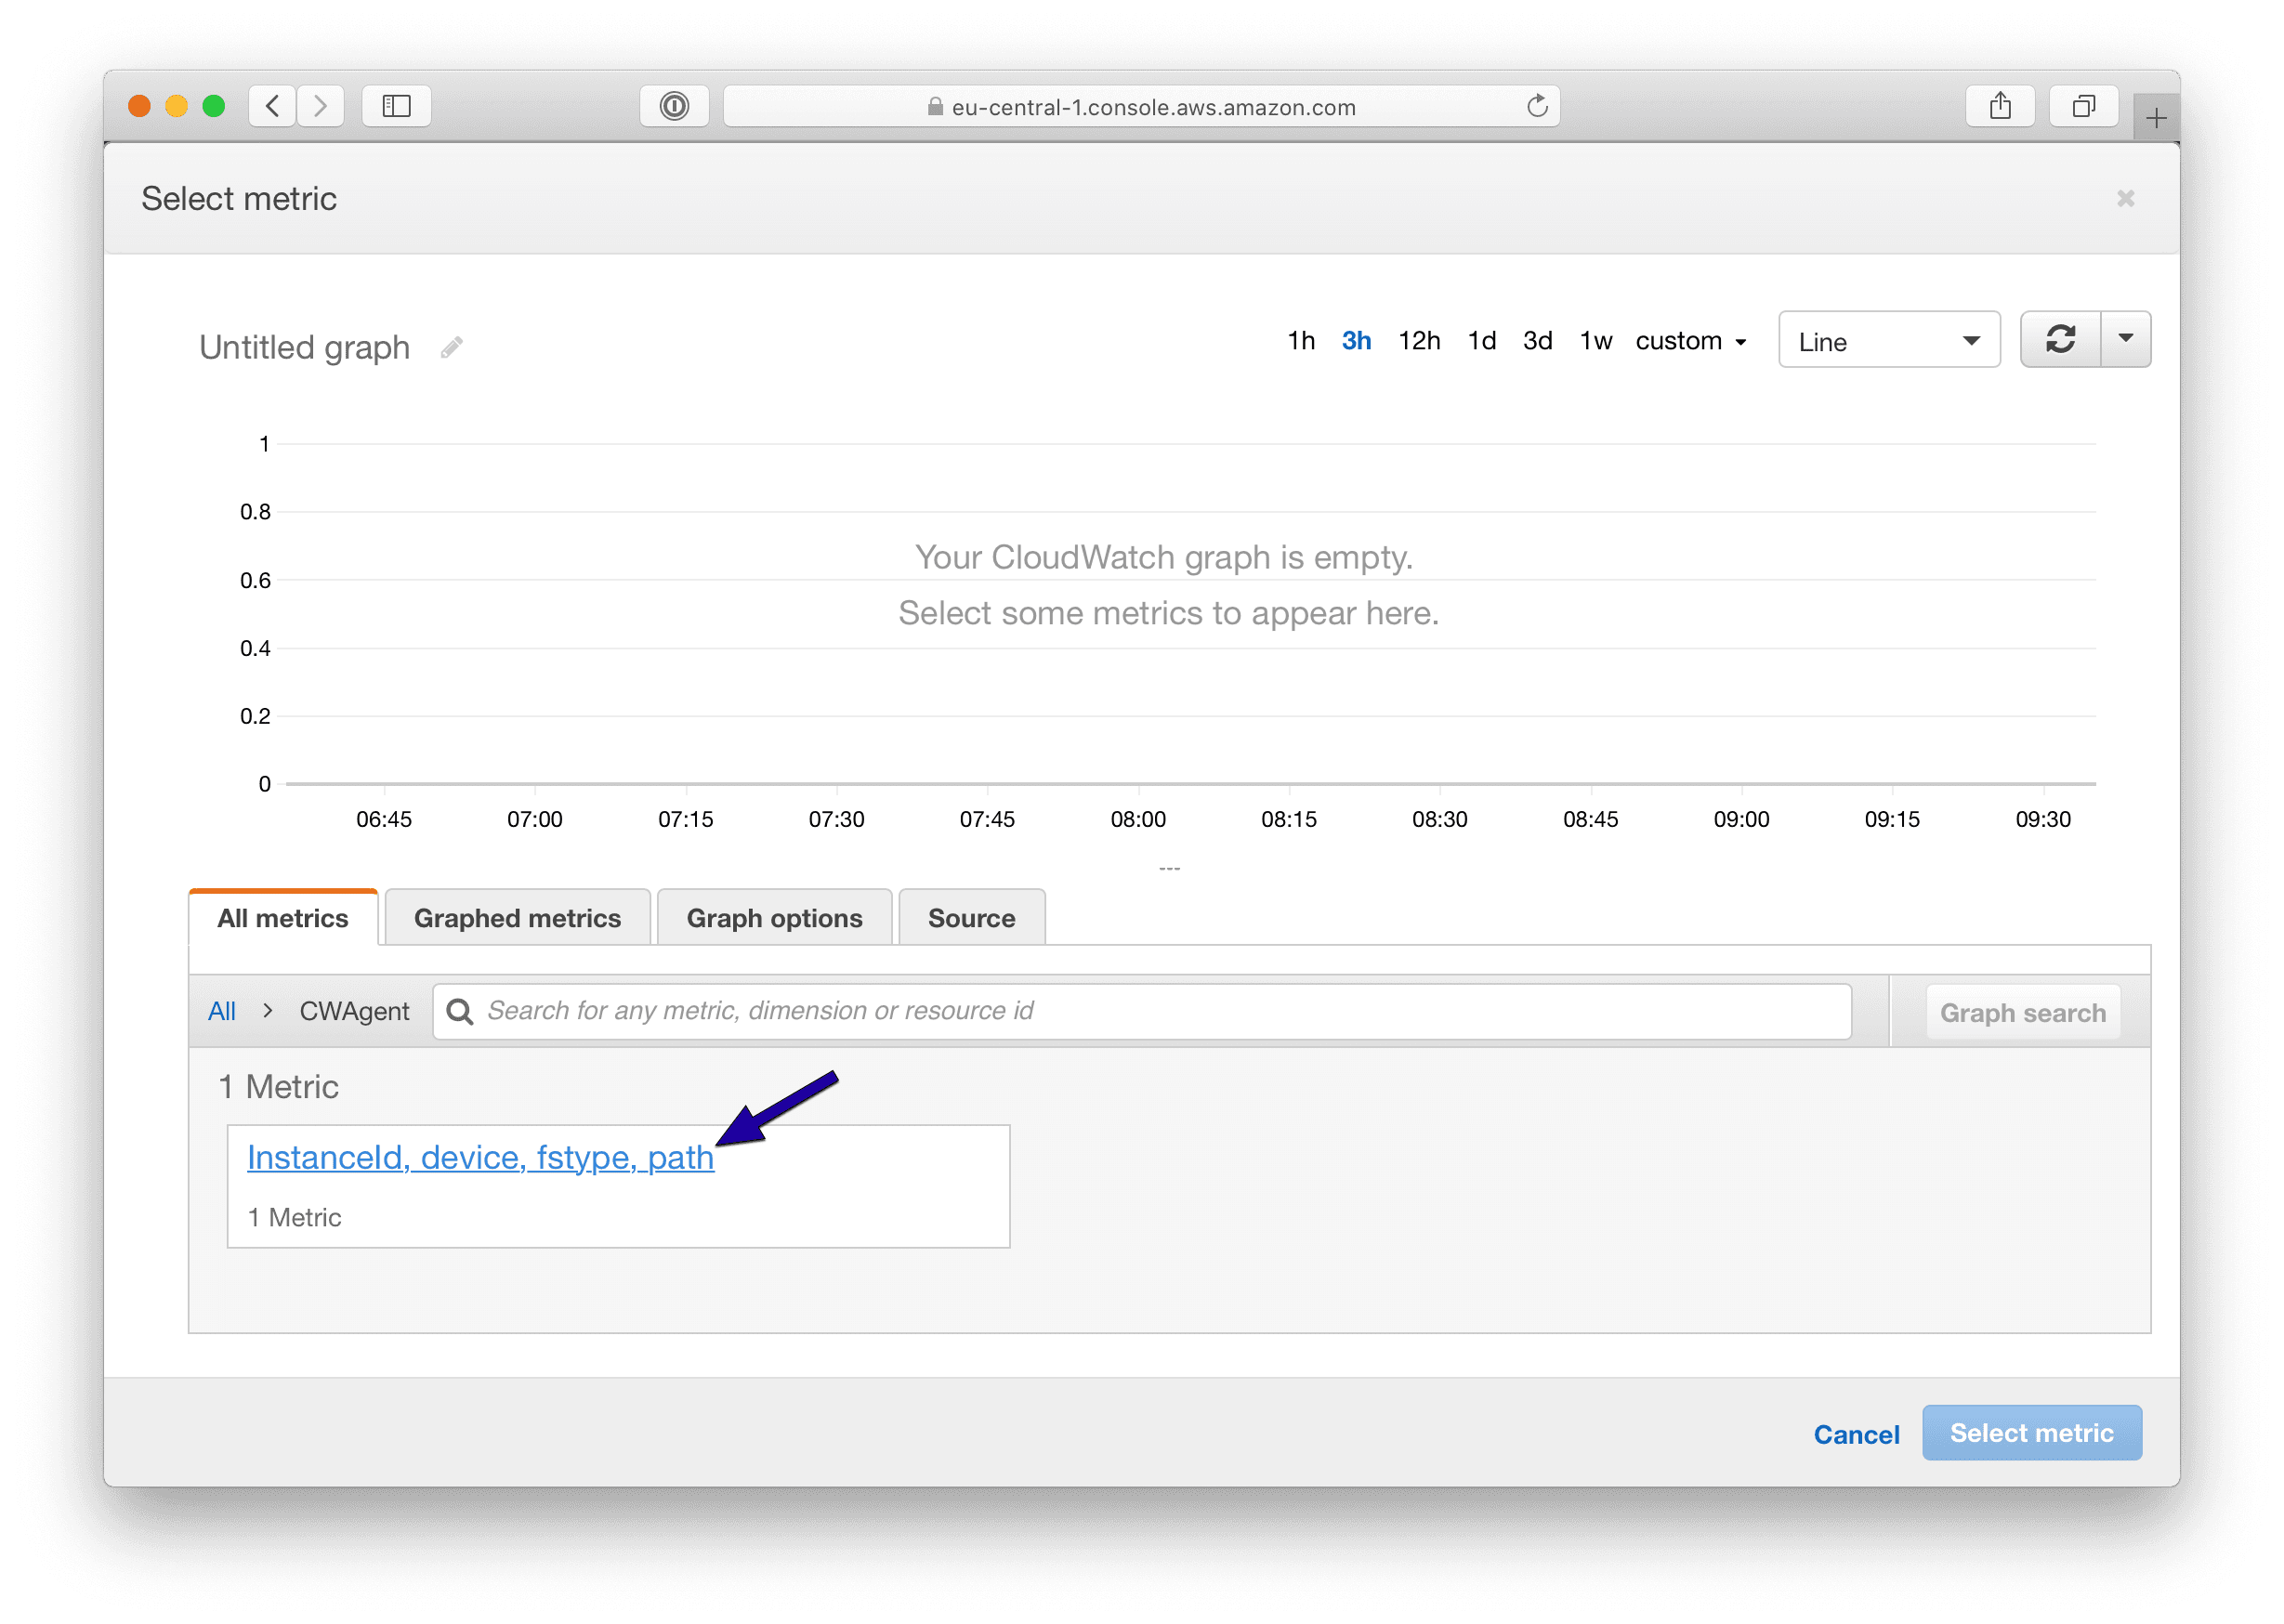
The CloudWatch agent reports metrics with the following dimensions:
InstanceIddevicefstypepath
Therefore, click the InstanceId, device, fstype, path link.
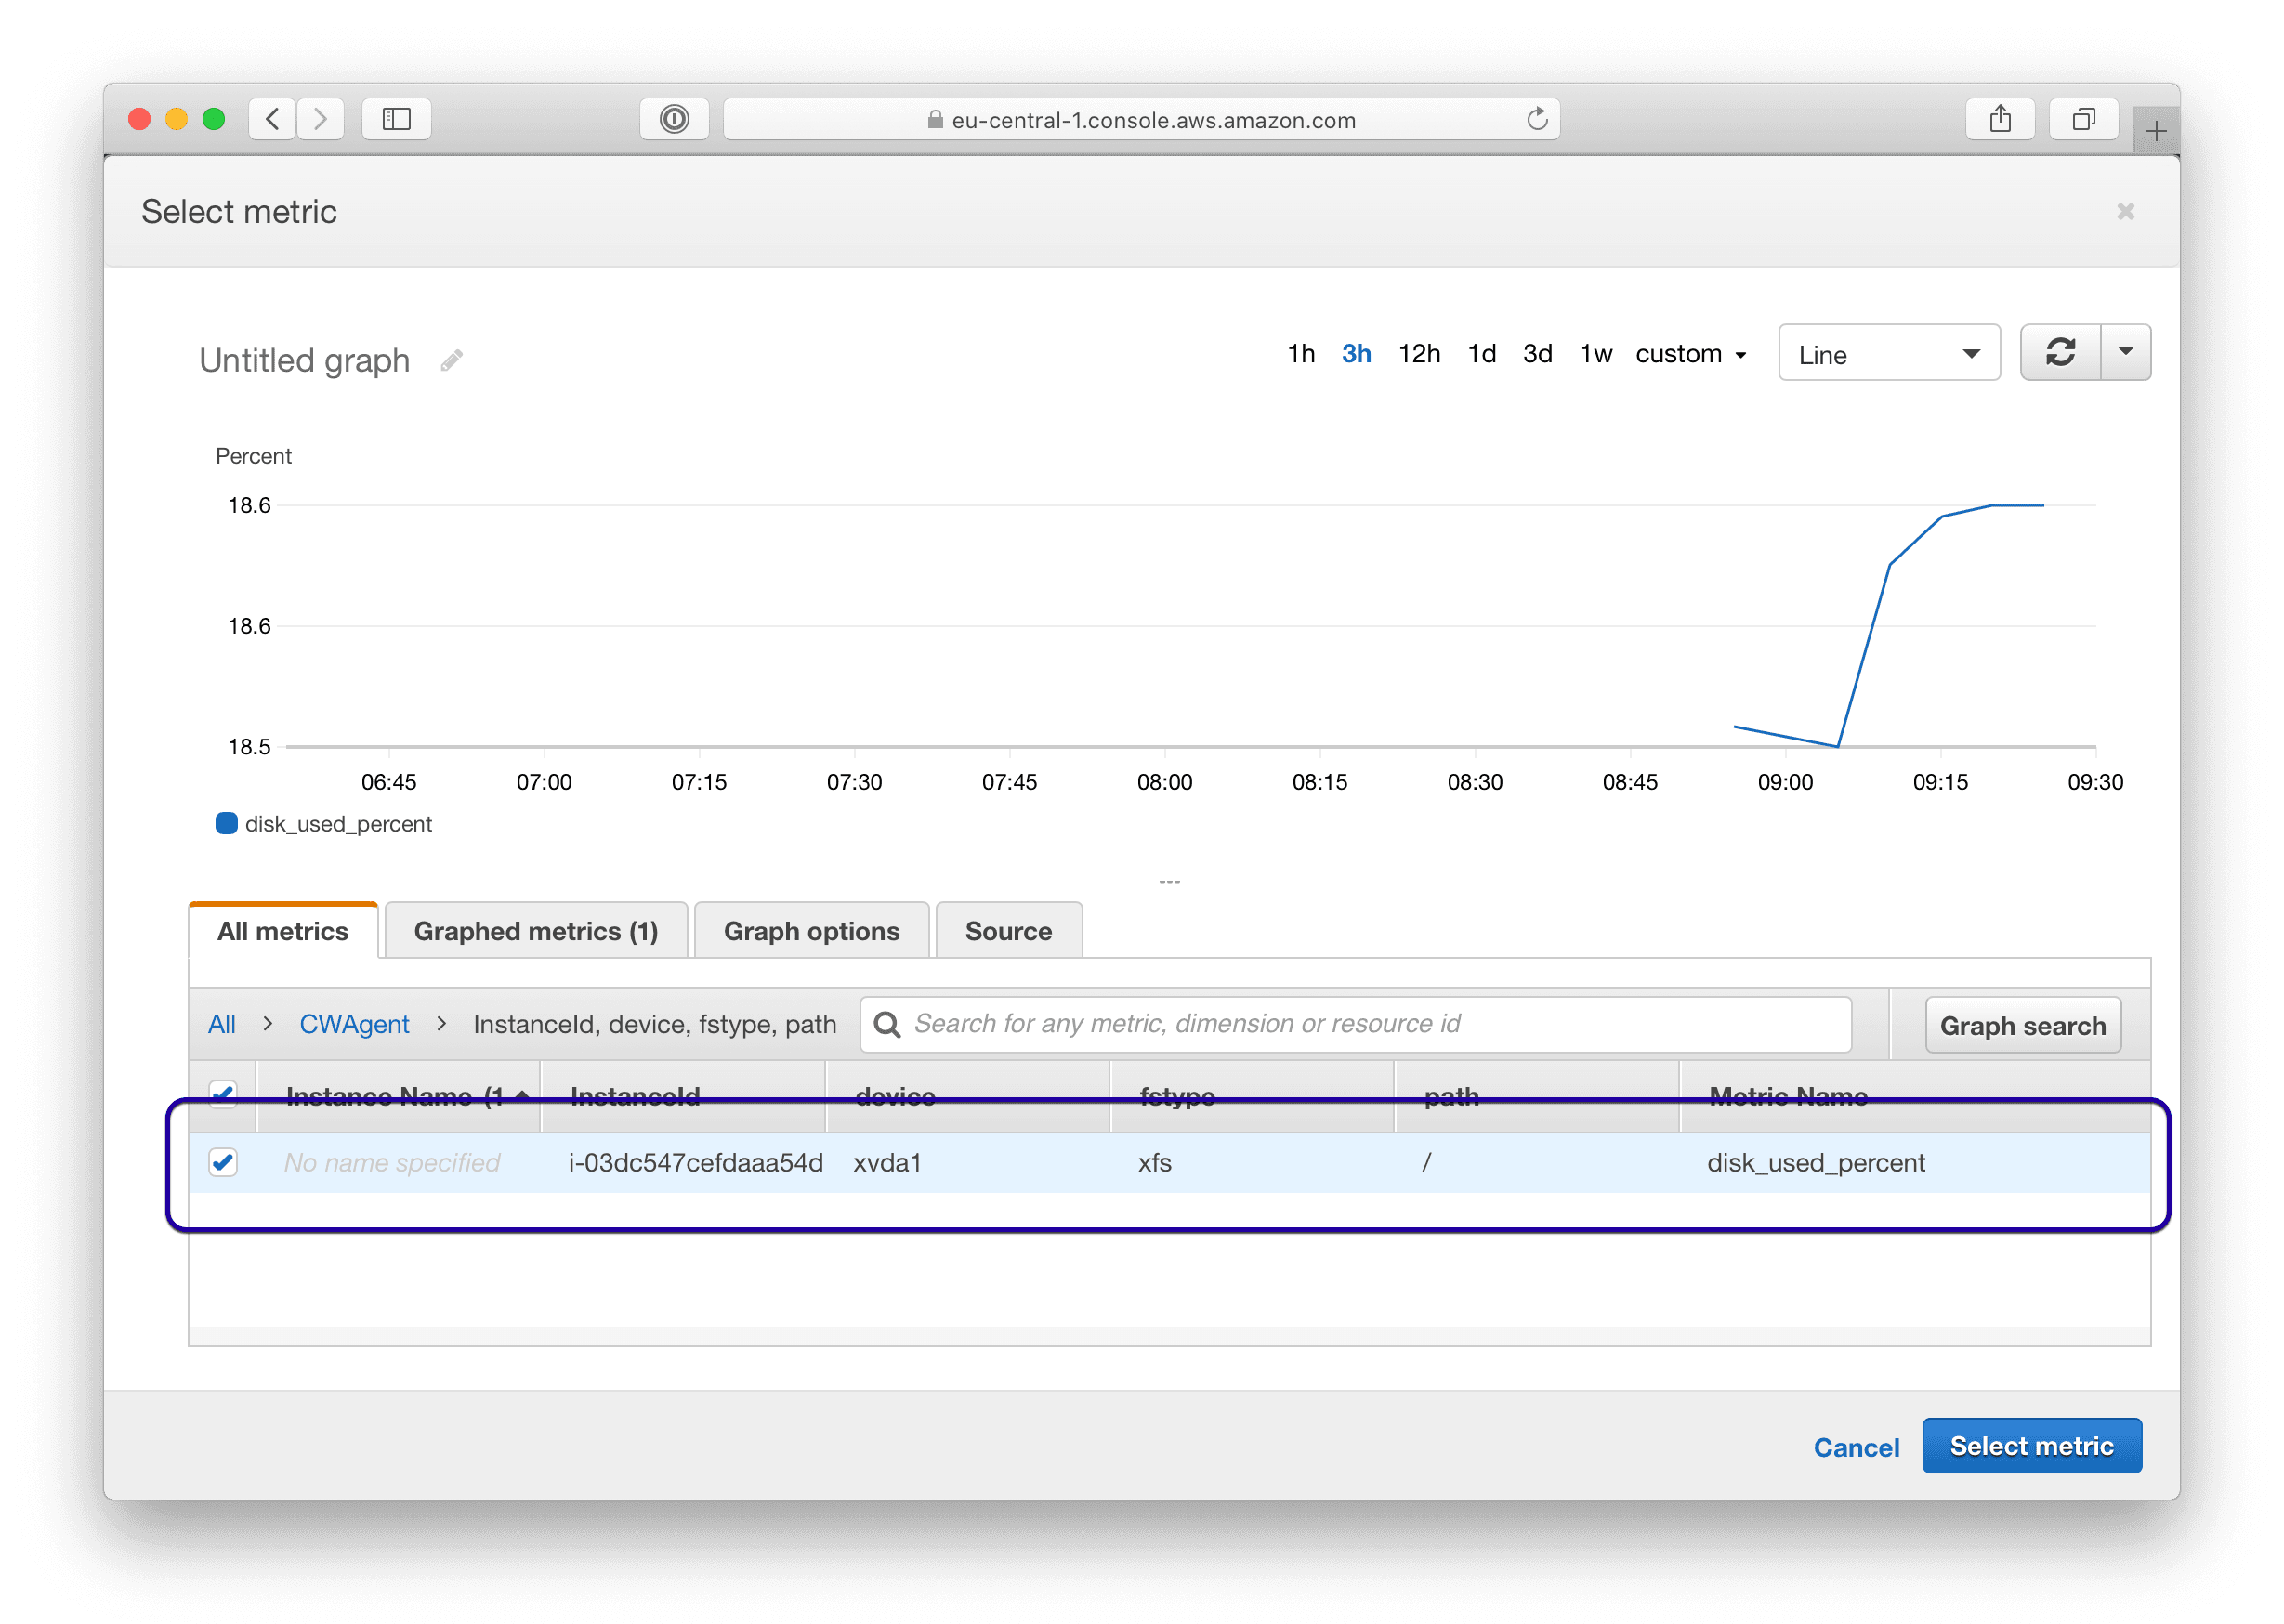
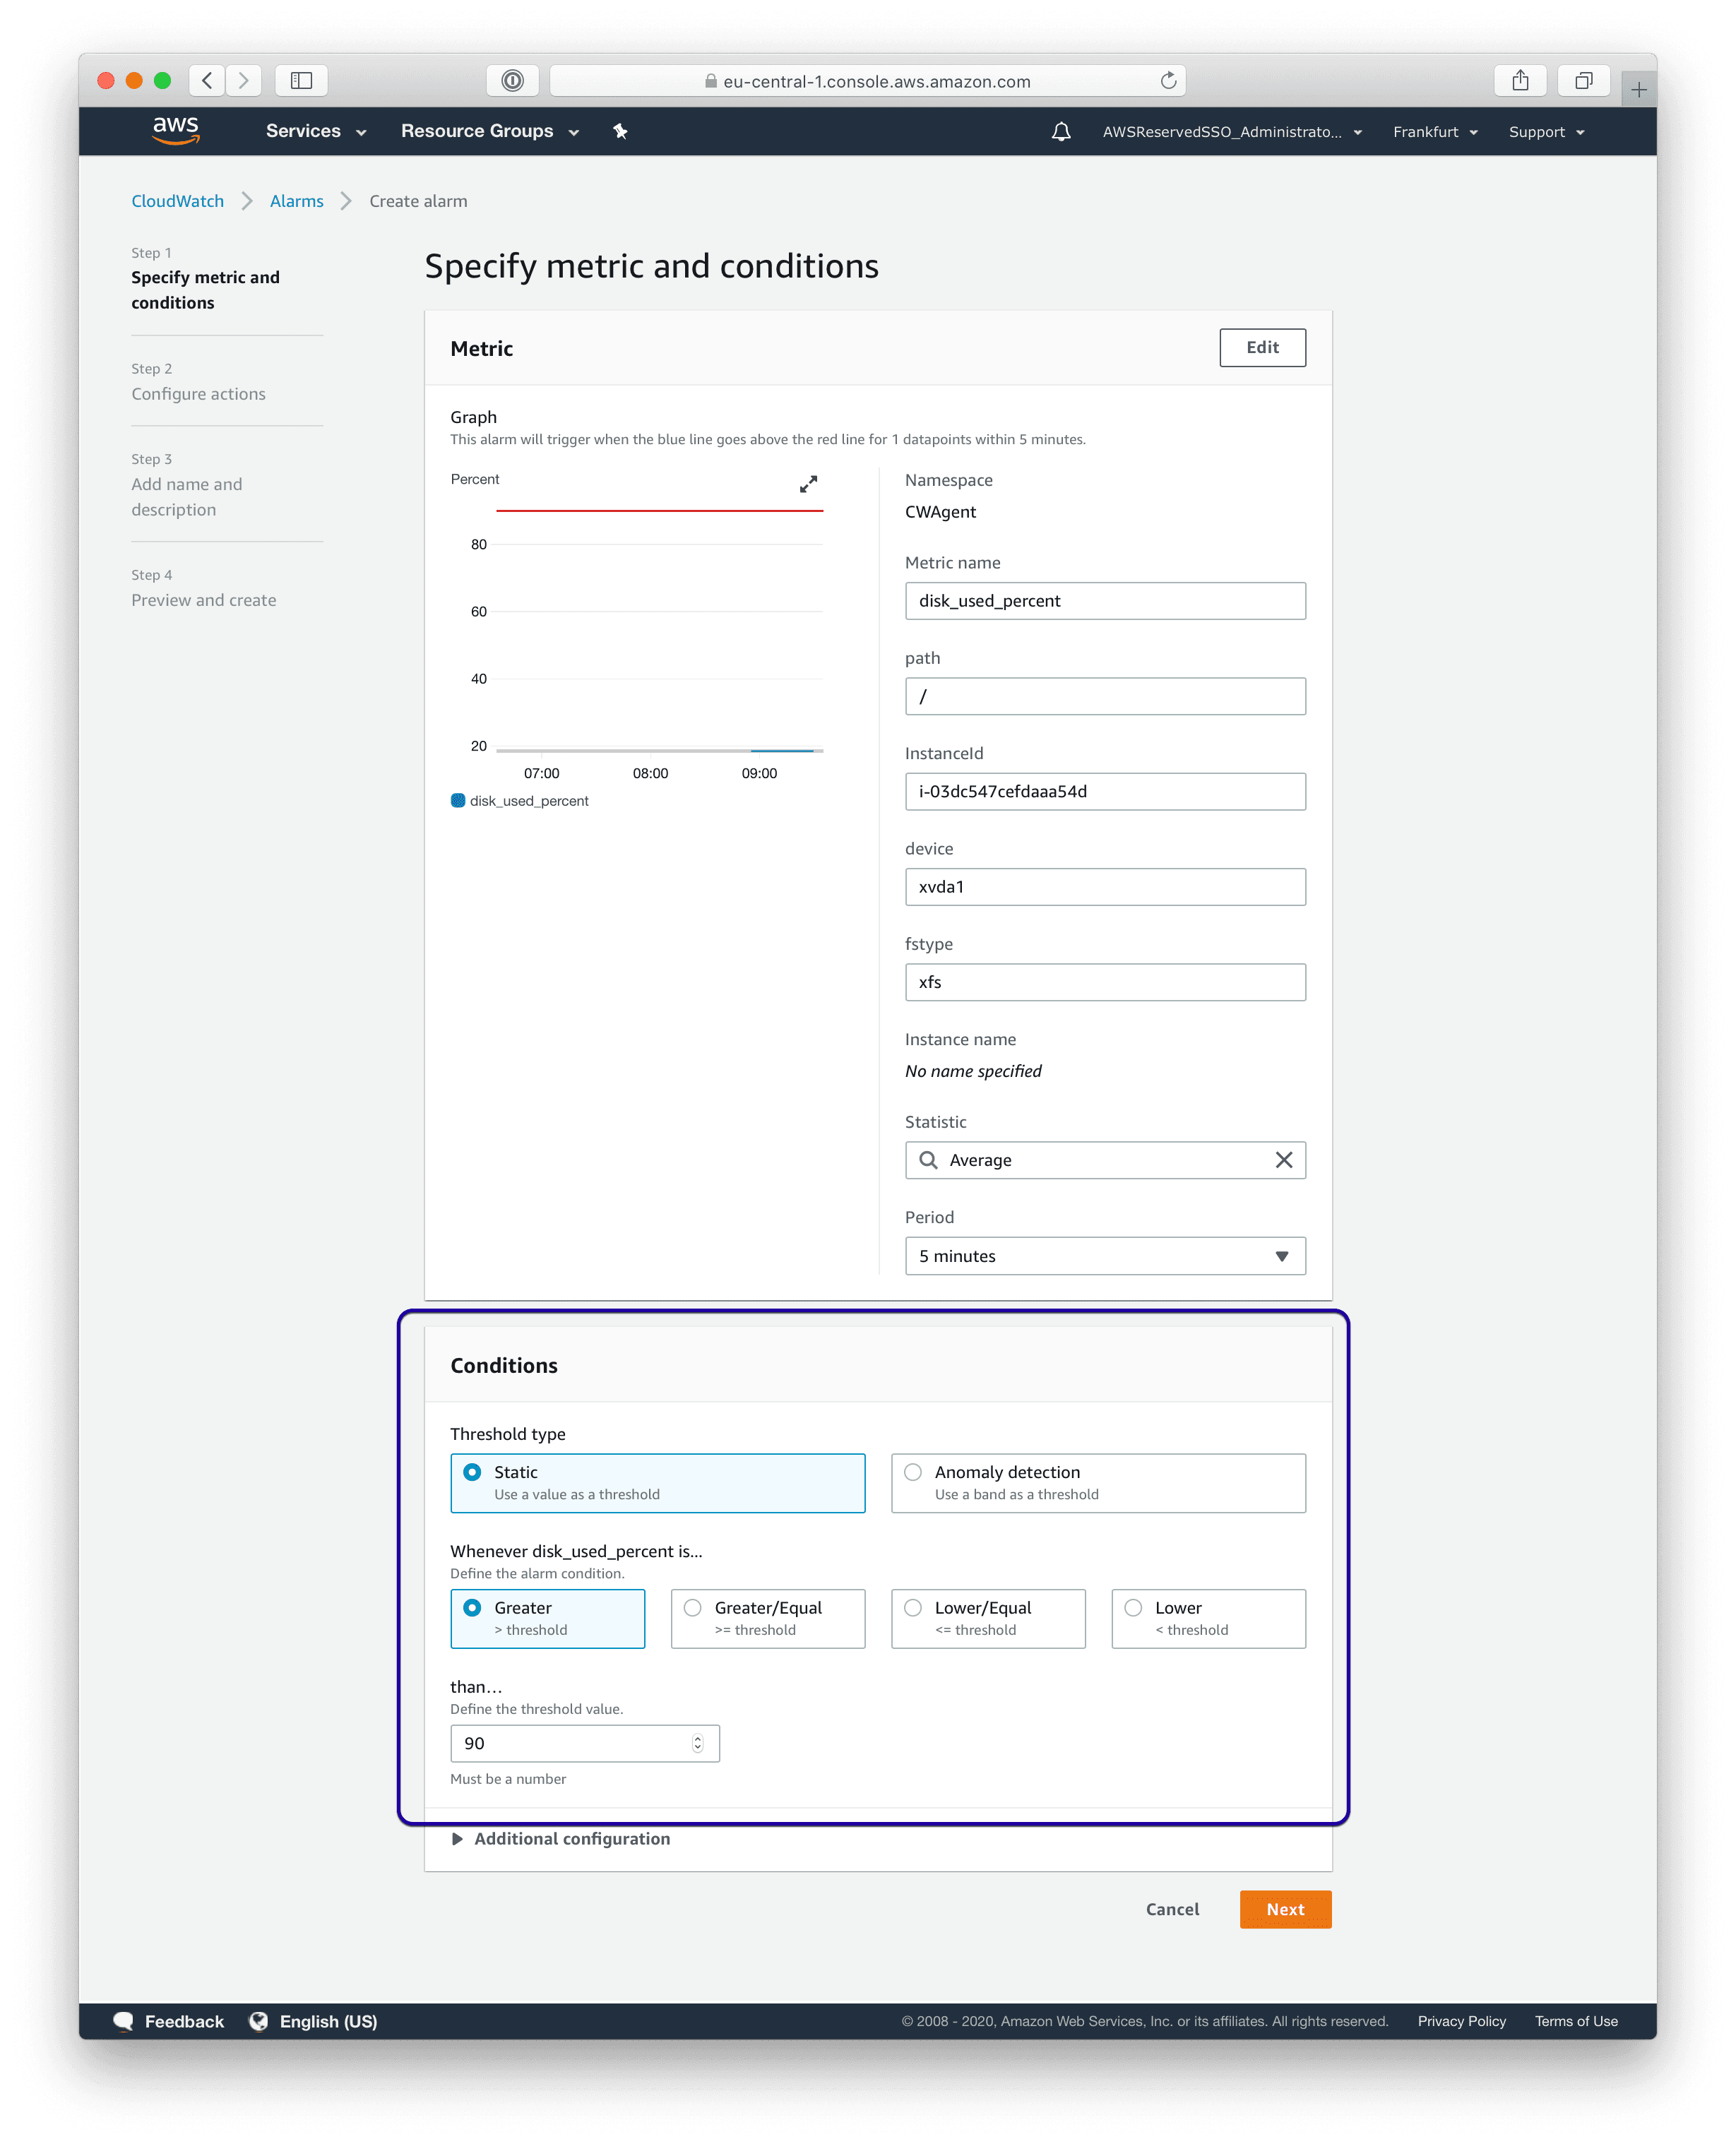
Search for the metric with the InstanceId of your EC2 instance and the mount path that you want to monitor. For example, the mount path /. Then, select the metric and press the Select metric button.
Configure a threshold for the alarm. For example, I want to get notified when the disk usage is higher than 90%, which means less than 10% disk space is available.
Additionally, you could set the Missing data treatment to
Treat missing data as badin the Additional configuration section. Doing so will send an alarm whenever the CloudWatch agent stops working as well.
Don’t forget to press the Next button.
Configure a notification to make sure you get notified whenever your EC2 instance runs out of disk space. You can do so by creating a new SNS topic and adding your e-mail address, for example.
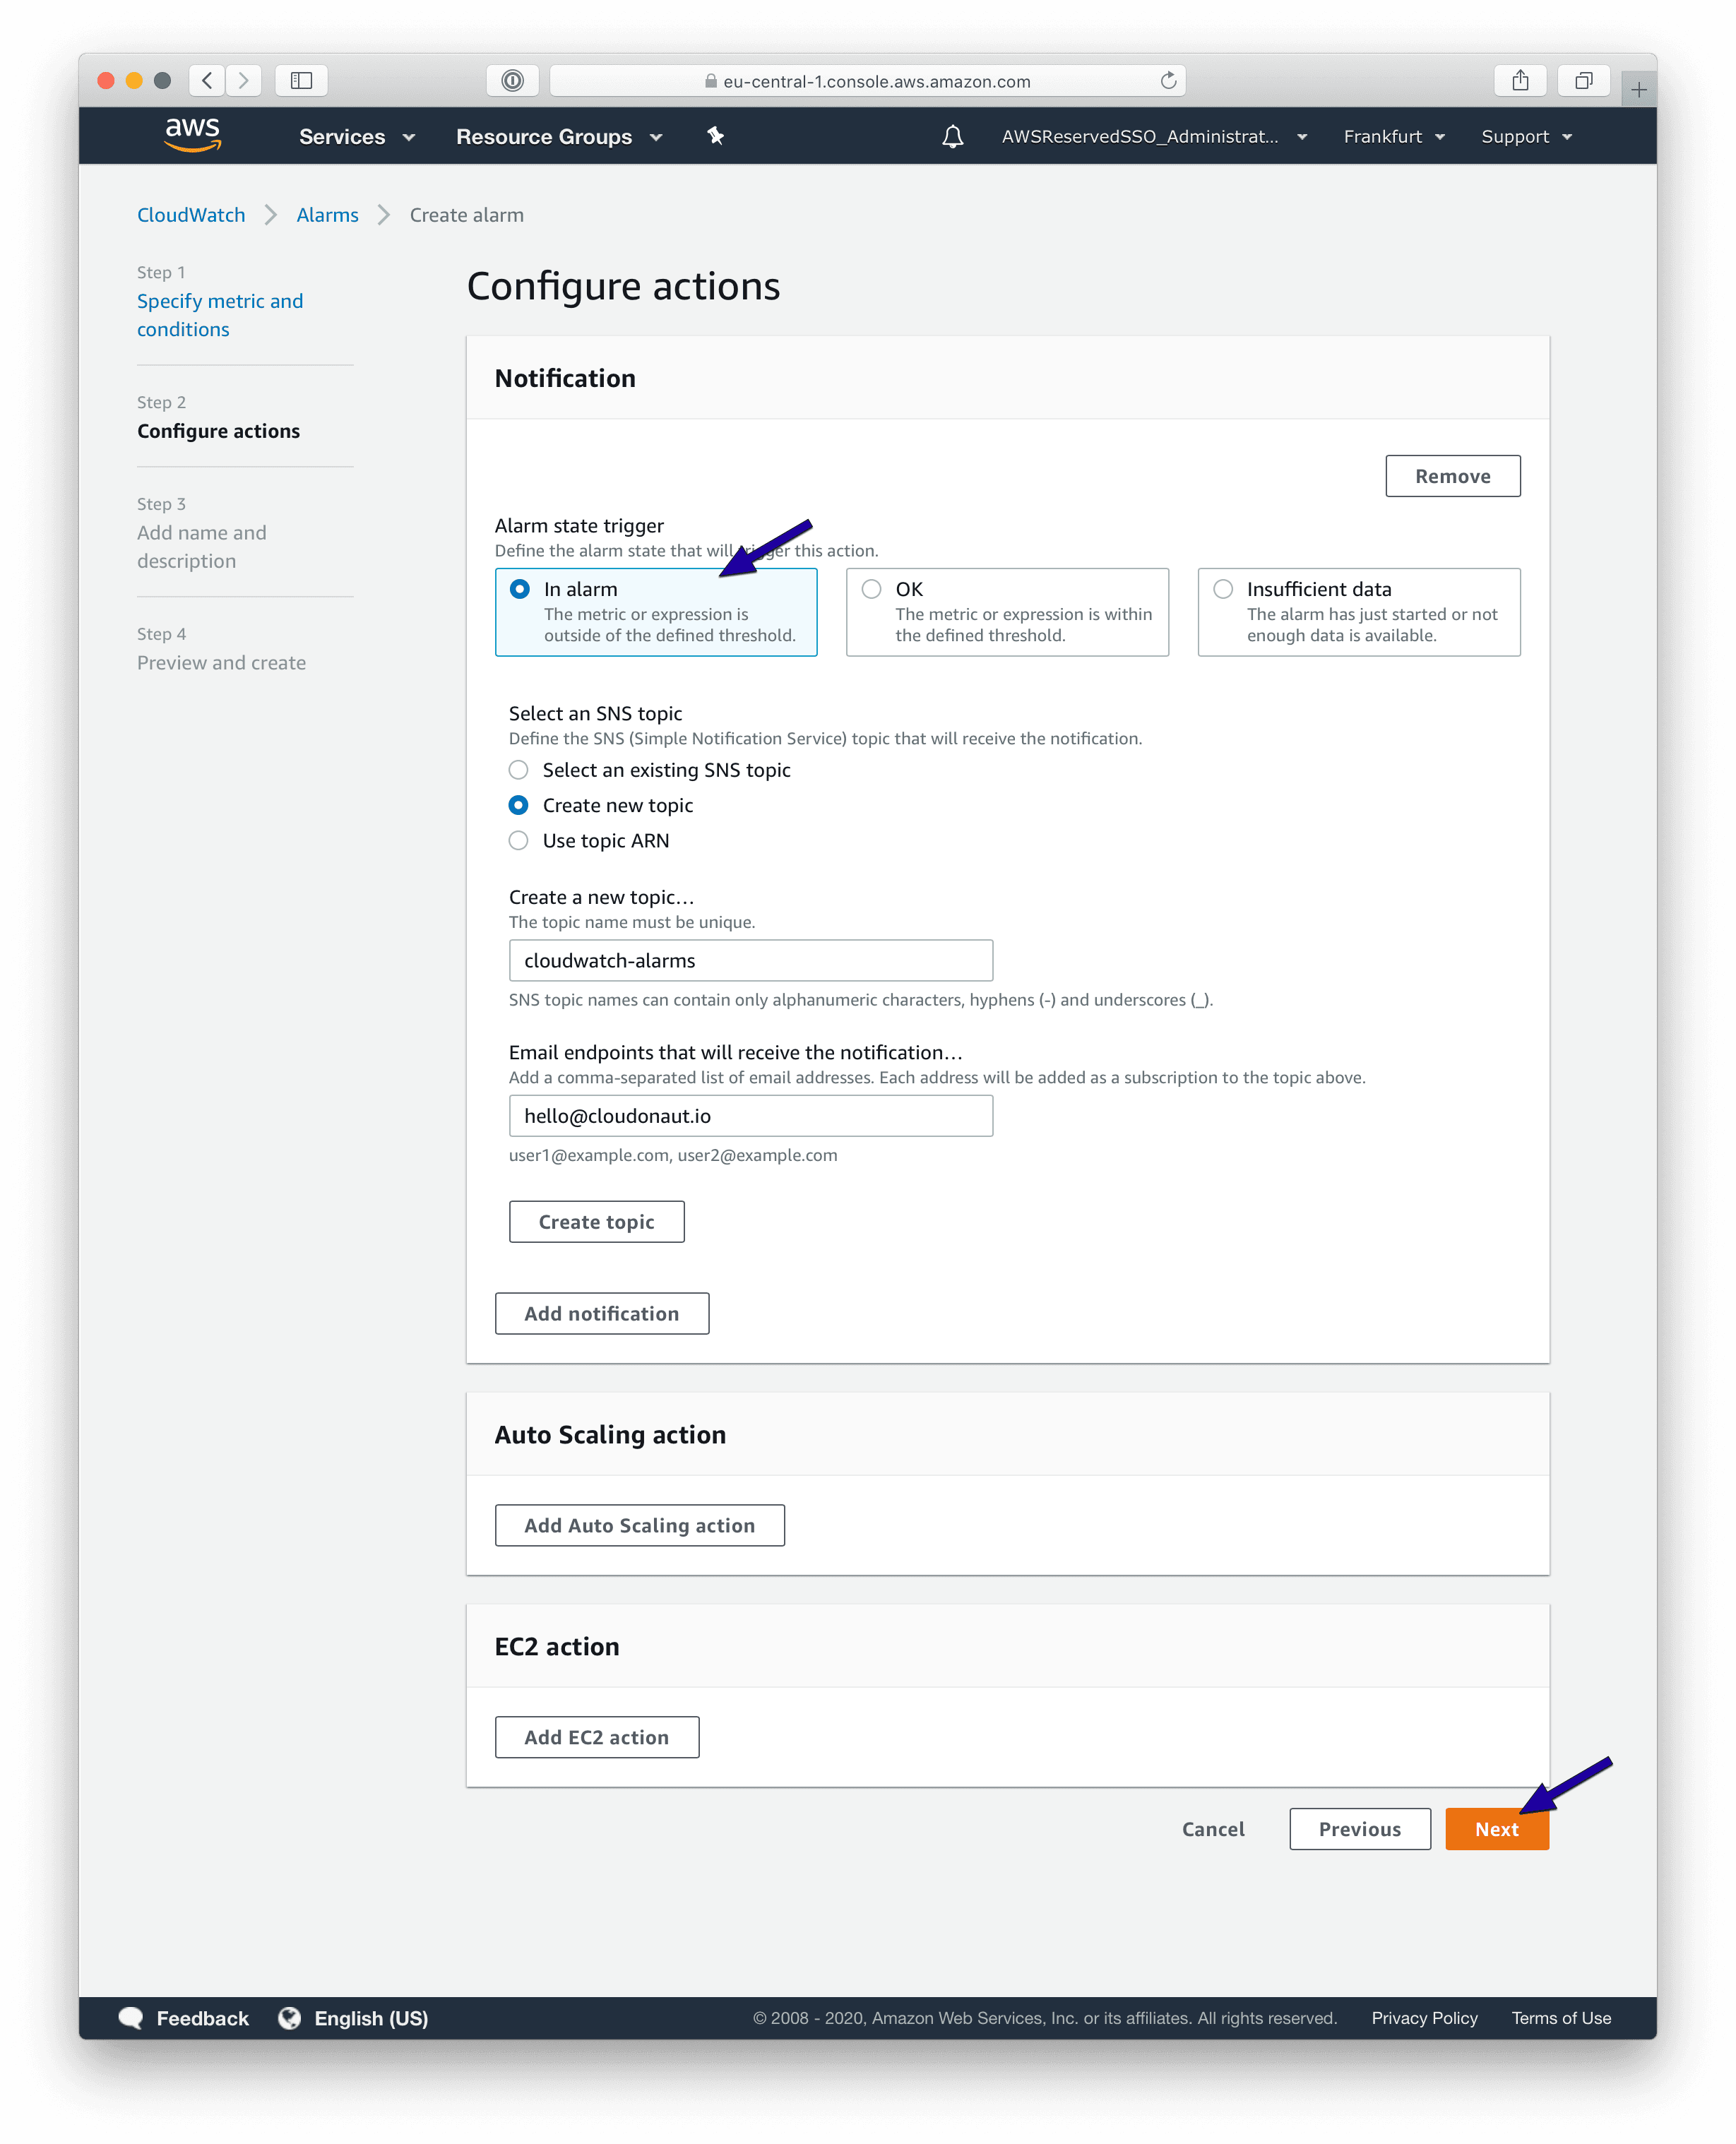
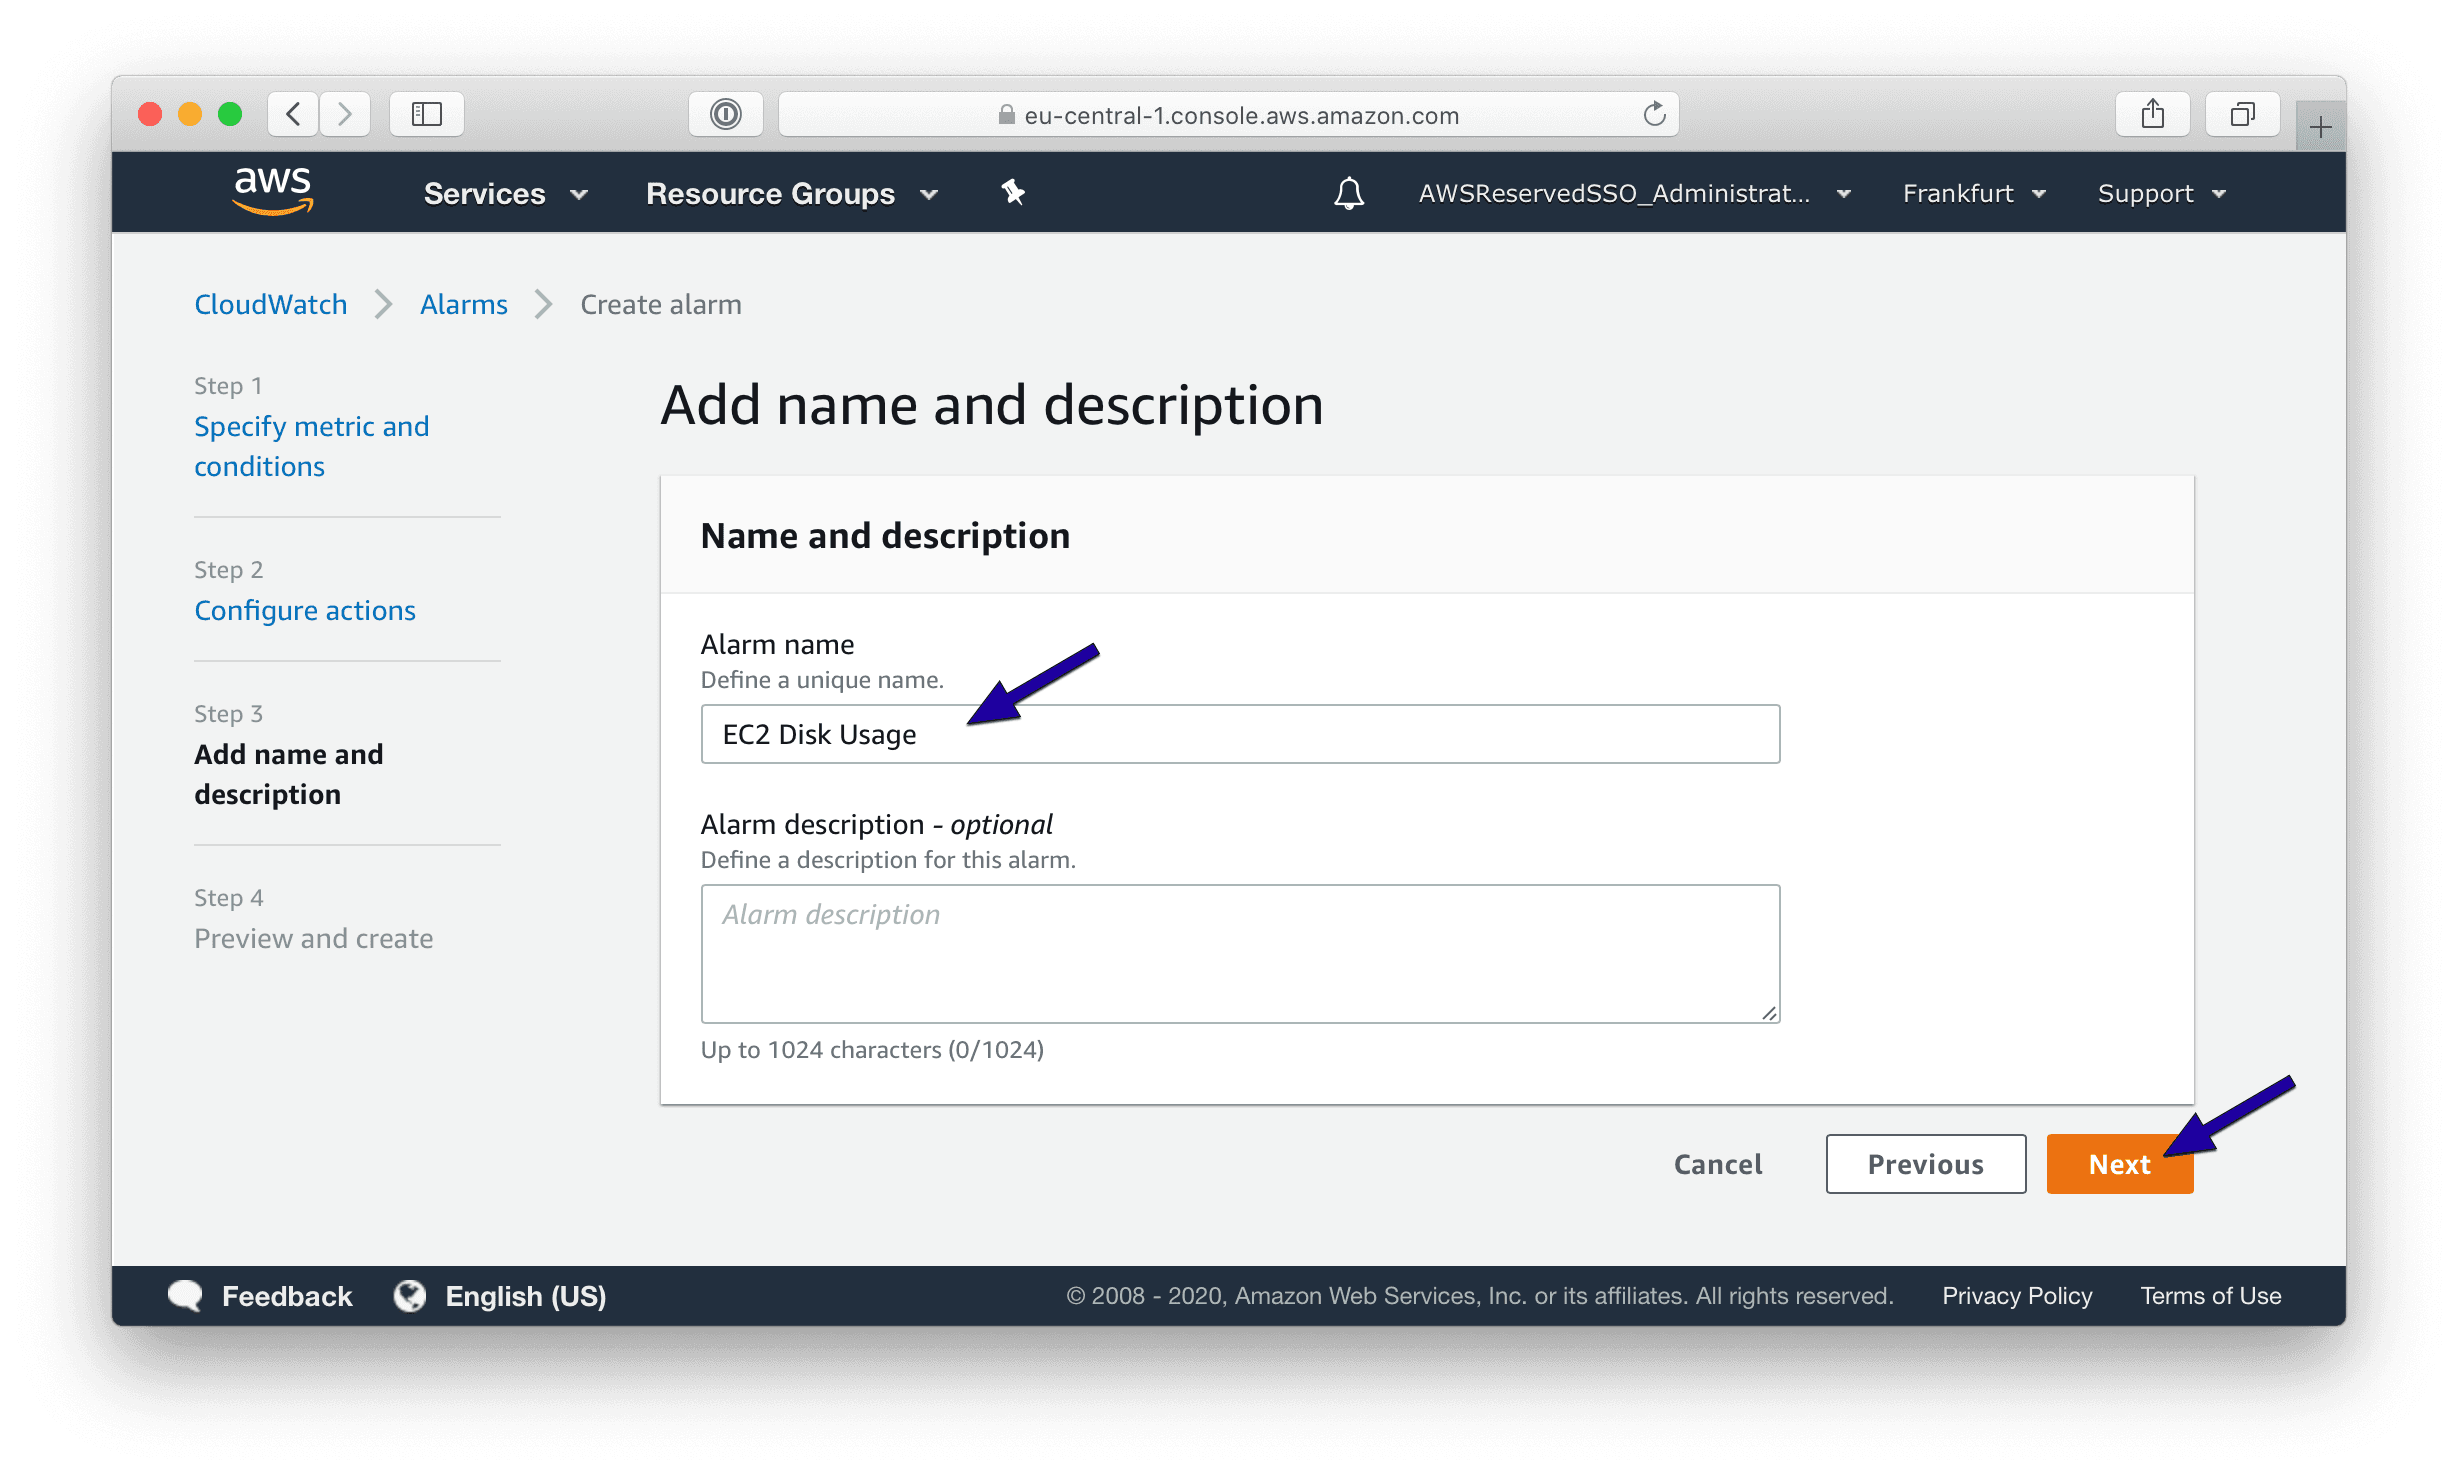
You should define a name and description for the CloudWatch alarm. Ensure you include all relevant information that will help you react in the case of alarm notification. Press the Next button.
Finally, the wizard shows a preview. Click the Create alarm button.
That’s it. You are now monitoring the disk utilization of your EC2 instance. Read on to learn how to receive alarm notifications via Slack or Microsoft Teams instead of e-mail.
Send CloudWatch alarm to Slack or Microsoft Teams
Dealing with all the e-mails notifying you about alarms from your AWS infrastructure can be frustrating, especially if you are part of a team responsible for keeping the systems up and running.
Check out marbot, a chatbot for Slack, and Microsoft Teams supporting your team to monitor your AWS infrastructure.
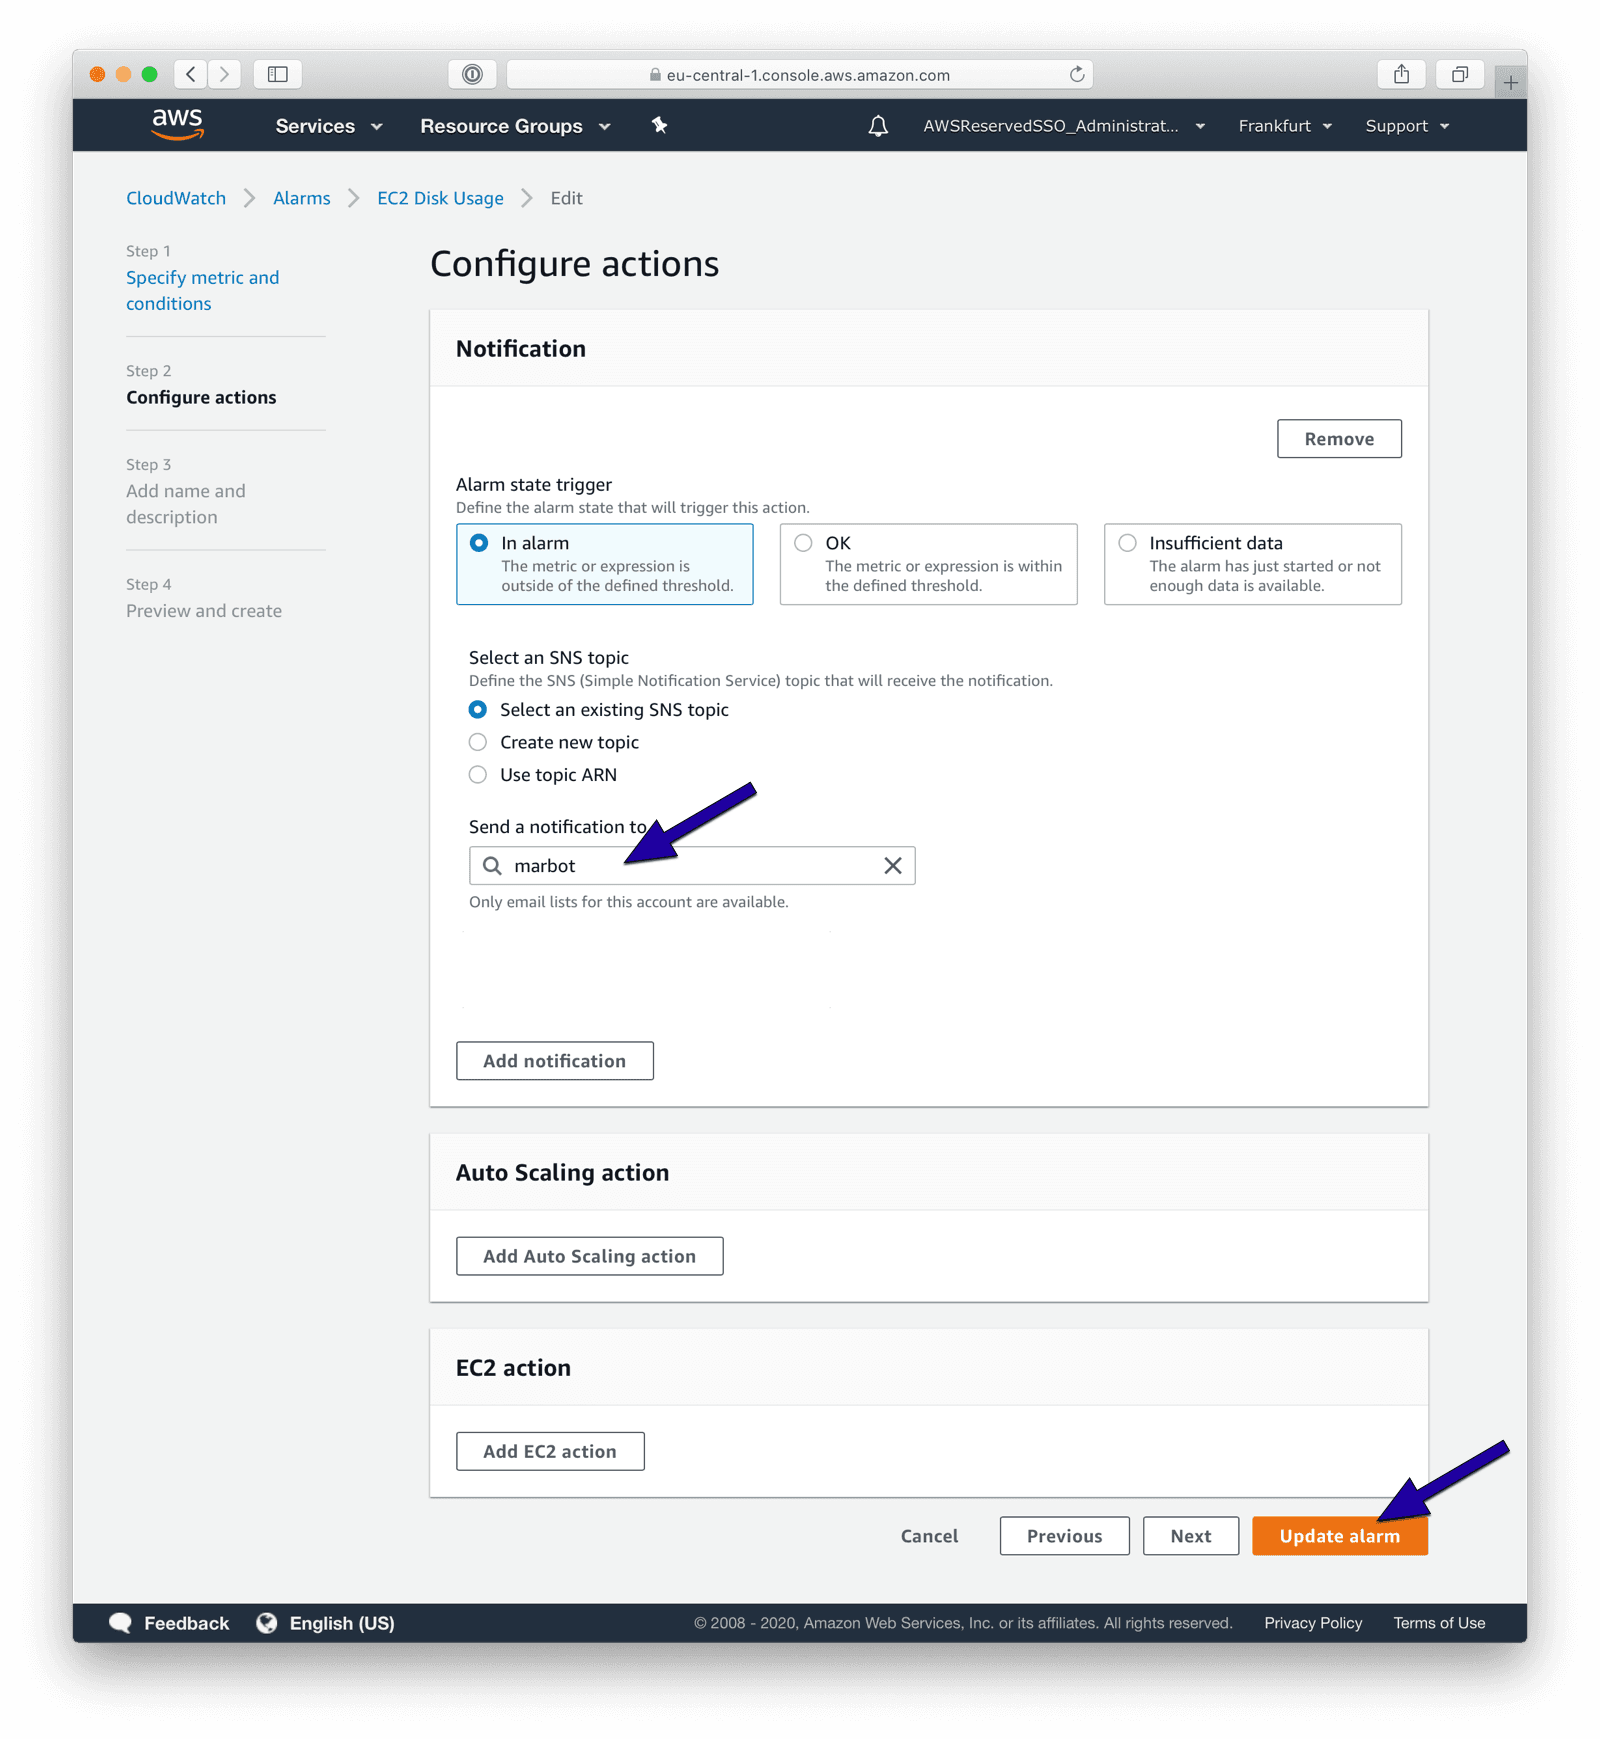
To receive a message in Slack or Microsoft Teams, edit the CloudWatch alarm.
- Add marbot to Slack or Microsoft Teams.
- Invite marbot to a channel.
- In the AWS Console, search for an existing topic marbot.
- If the marbot topic is found, click on it.
- If no topic is found, go to the channel and type:
@marbot Create an SNS topic
Follow the wizard and repeat the steps above. - Press the Update alarm button.
You will receive alarms via Slack or Microsoft Teams in the future! Do you have any questions? Please send me a message!
Take your AWS monitoring to a new level! Chatbot for AWS Monitoring: Configure monitoring, escalate alerts, solve incidents.

Andreas Wittig
Consultant focusing on Amazon Web Services (AWS). Entrepreneur building marbot.io. Author of Amazon Web Services in Action, Rapid Docker on AWS, and cloudonaut.io.
You can contact me via Email, Twitter, and LinkedIn.
Published on