End-user monitoring of your website with CloudWatch Synthetics
Michael Wittig – 04 Jun 2020
There are countless reasons why your website is not working as your users expect. From a technical point of view, you can monitor your load balancers, your web servers, and your database. But what if that external script that you embed is breaking your site? Expired TLS certificate? Something wrong with DNS? How can you test that your website works for real users?

Browsers can be used in an automated way controlled by a script. Wait for an element to become visible. Click on a link. Enter a form field. puppeteer allows you to remote control a headless Chrome browser in Node.js and is maintained by Google. We can monitor the user experience on our website if we can find a way to run a puppeteer script at regular intervals and record the results.
And that’s where Amazon CloudWatch Synthetics enters the stage. It allows you to create canaries to execute puppeteer scripts on a schedule. Each run creates detailed logs, screenshots, and a record of all network calls in HAR https://en.wikipedia.org/wiki/HAR_(file_format) format uploaded to S3. All you need to do is provide a script that performs the test, or use one of the blueprints. The following Node.js script opens https://marbot.io, waits for an <h1> HTML element, checks the title and status code, and performs a screenshot.
const synthetics = require('Synthetics'); // CloudWatch Synthetics lib |
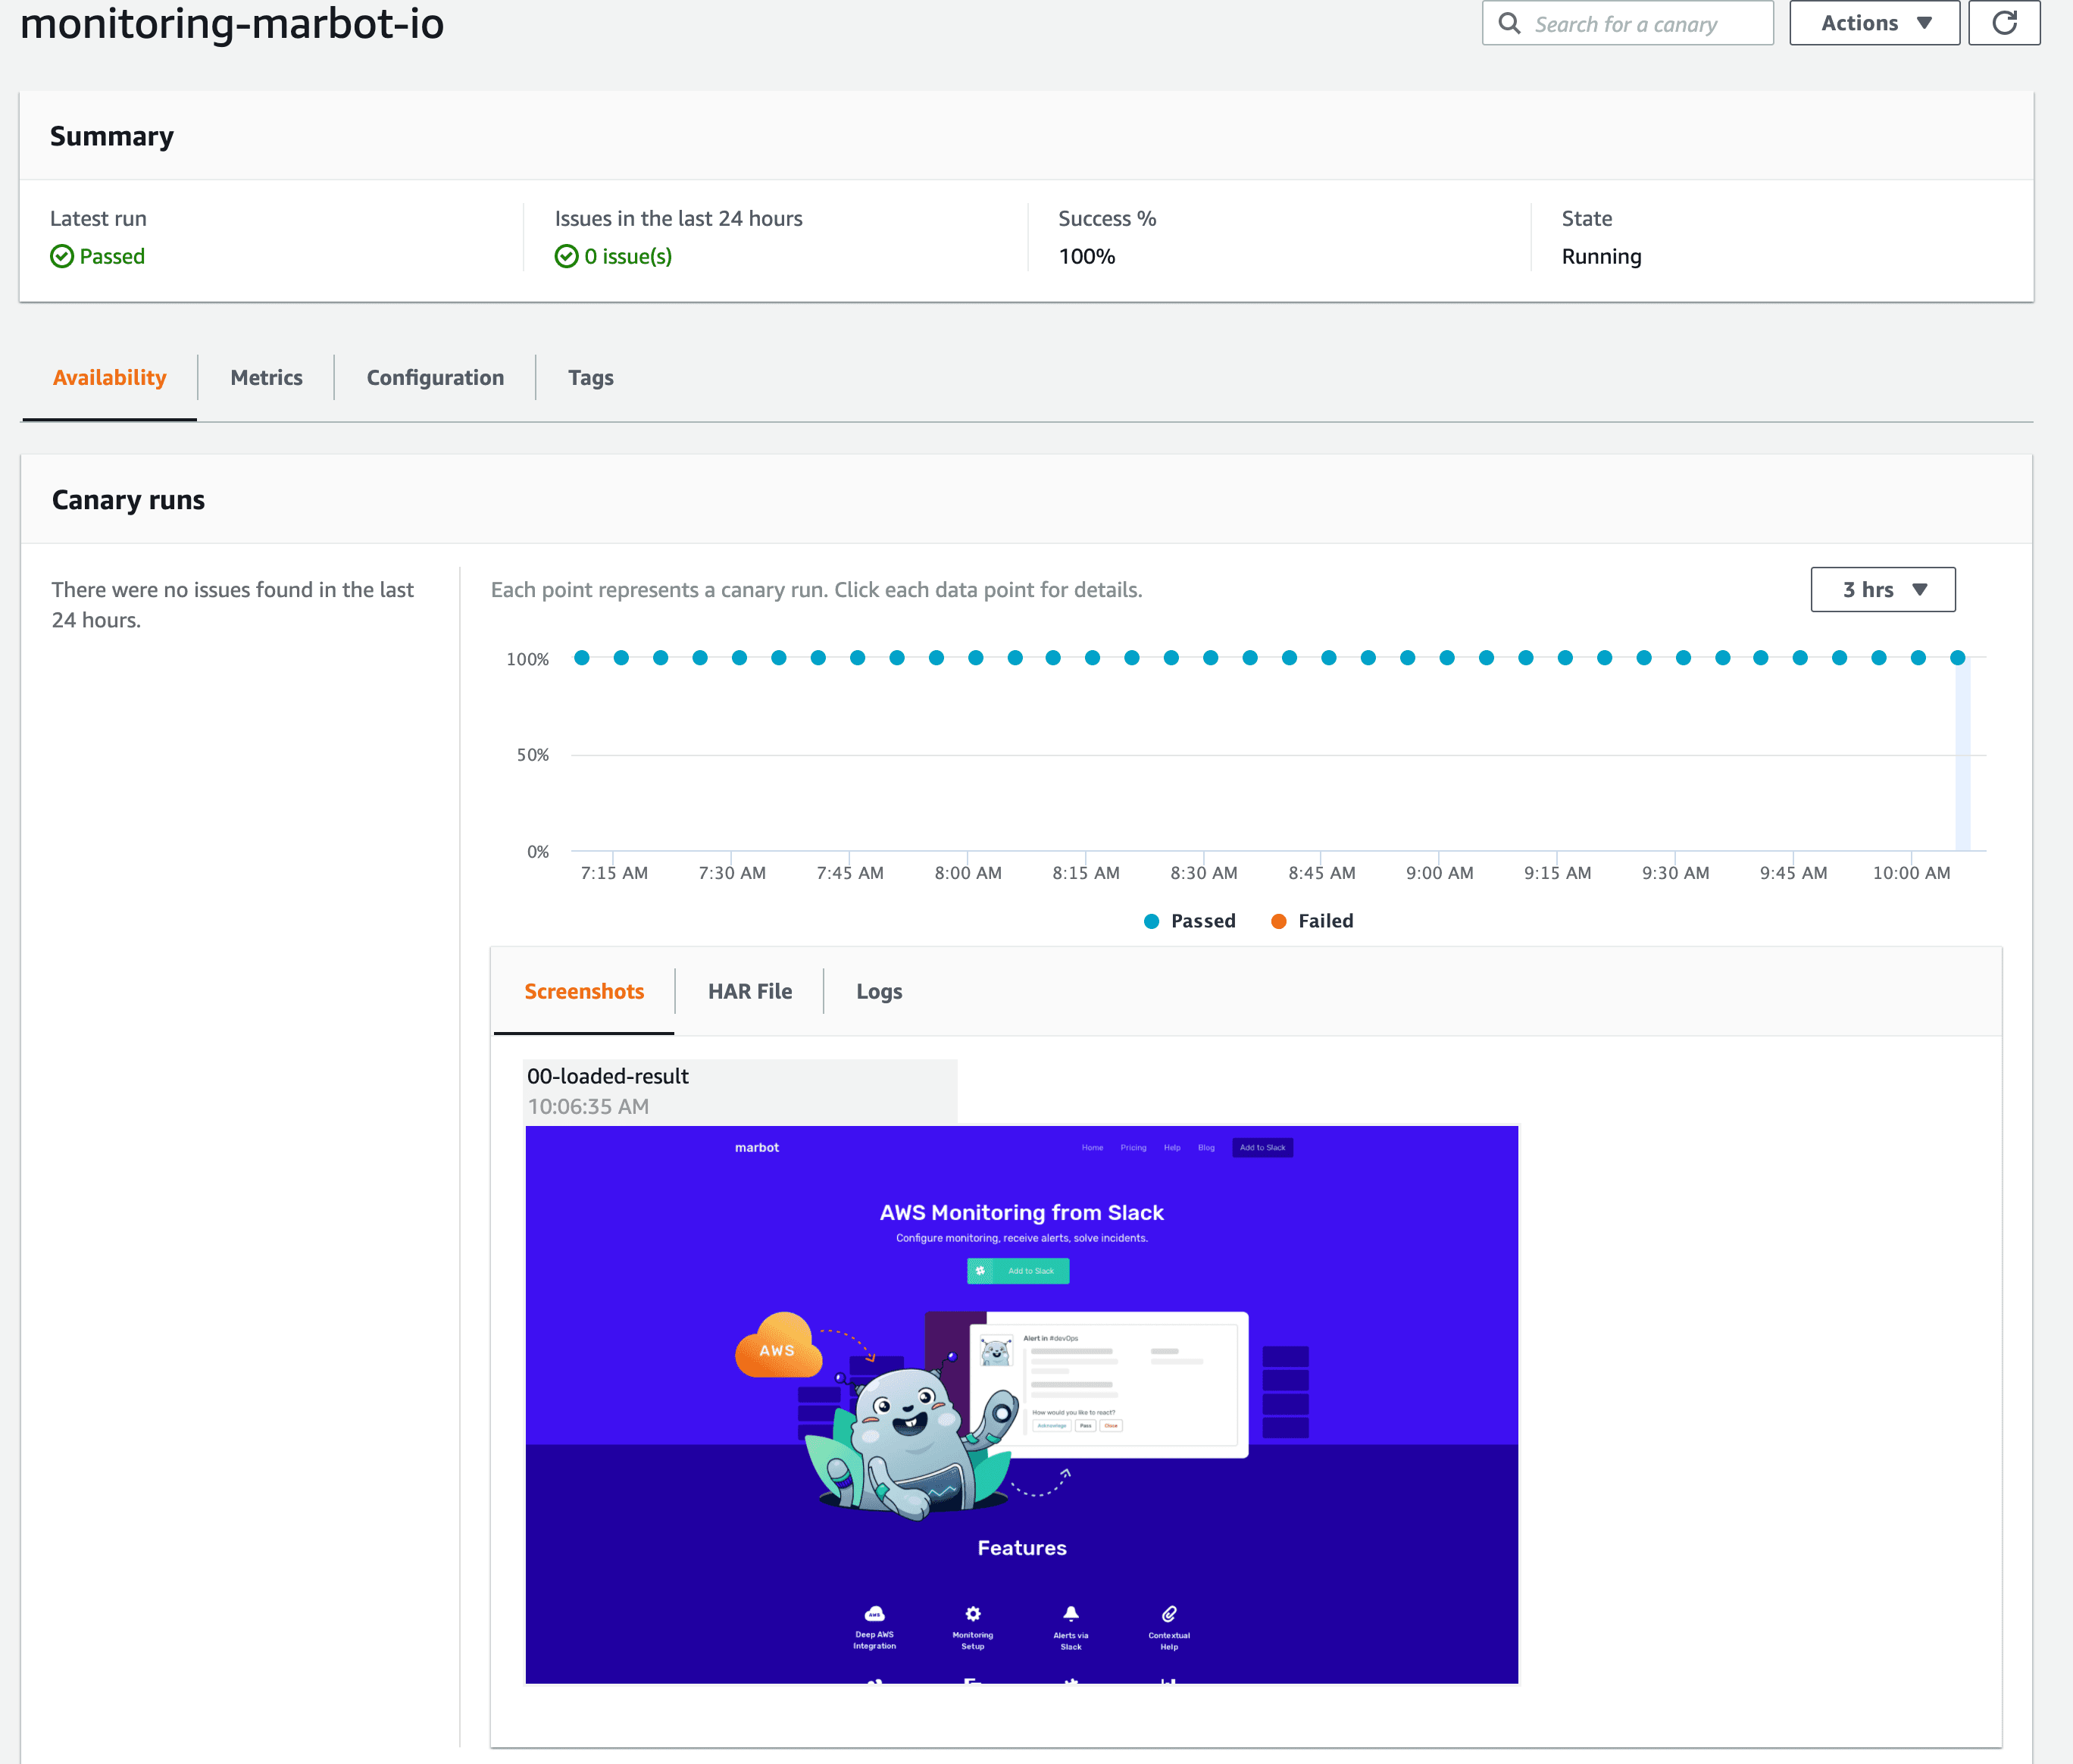
The rest is taken care of by CloudWatch Synthetics and is presented like this:

Want to get notified about failed canary runs? Create a CloudWatch Alarm that watches the metrics of the canary to alert you if things go wrong. To make this more comfortable for you, we integrated CloudWatch Synthetics into marbot.
Monitoring Assistant
Monitor your website and receive alerts in Slack or Microsoft Teams!It couldn't be easier!
- Add marbot to Slack or Microsoft Teams.
- Invite marbot to a channel.
- Follow the setup wizard.
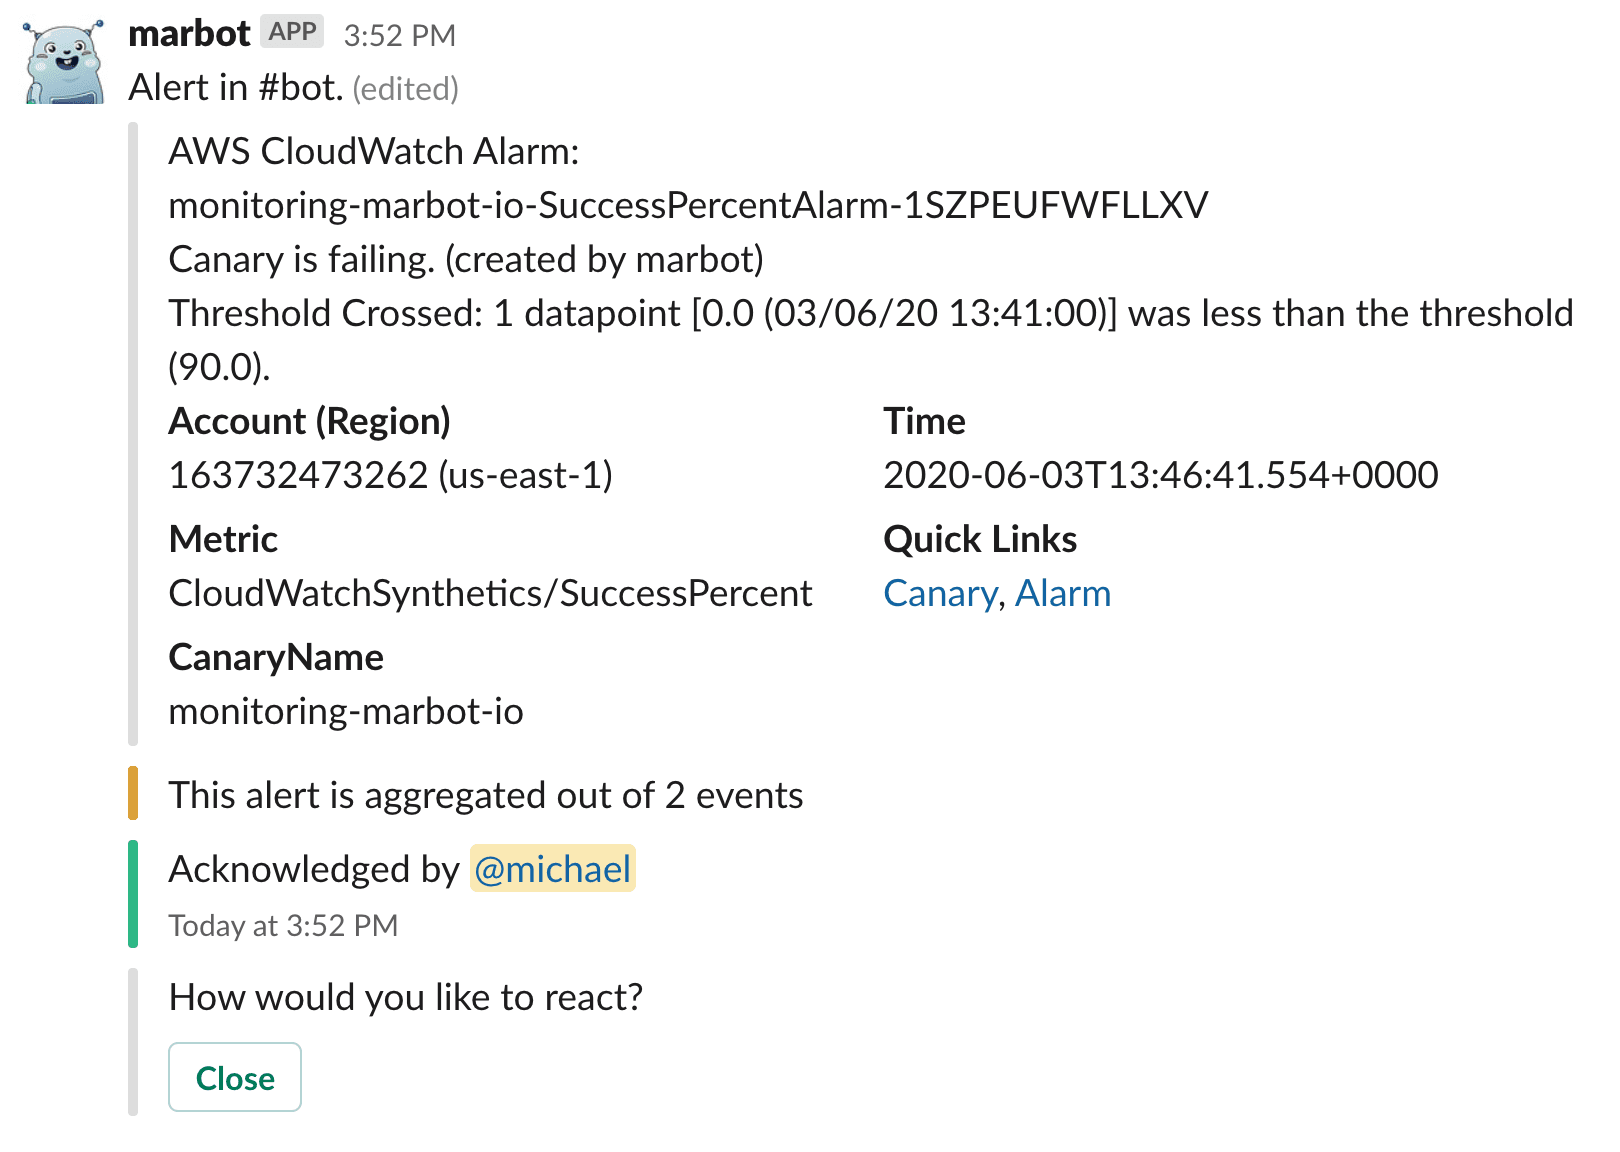
That’s it. Your website is now monitored from an end-user perspective. If things go wrong, you will receive a message like this:

Being able to write your own test scripts is a big benefit! Doing so allows you to implement sophisticated test scripts (simulate a user sign up, check out, …). Don’t forget to check out the CloudWatch pricing details.
Take your AWS monitoring to a new level! Chatbot for AWS Monitoring: Configure monitoring, escalate alerts, solve incidents.

