How to monitor Amazon Redshift?
Michael Wittig – 18 Sep 2020
A data warehouse is used for analyzing GBs or TBs of data and is a core component of business intelligence. AWS offers a popular data warehouse called Amazon Redshift. AWS is responsible for most aspects of operating the data warehouse. However, there are a few metrics that you should monitor to ensure smooth operation.

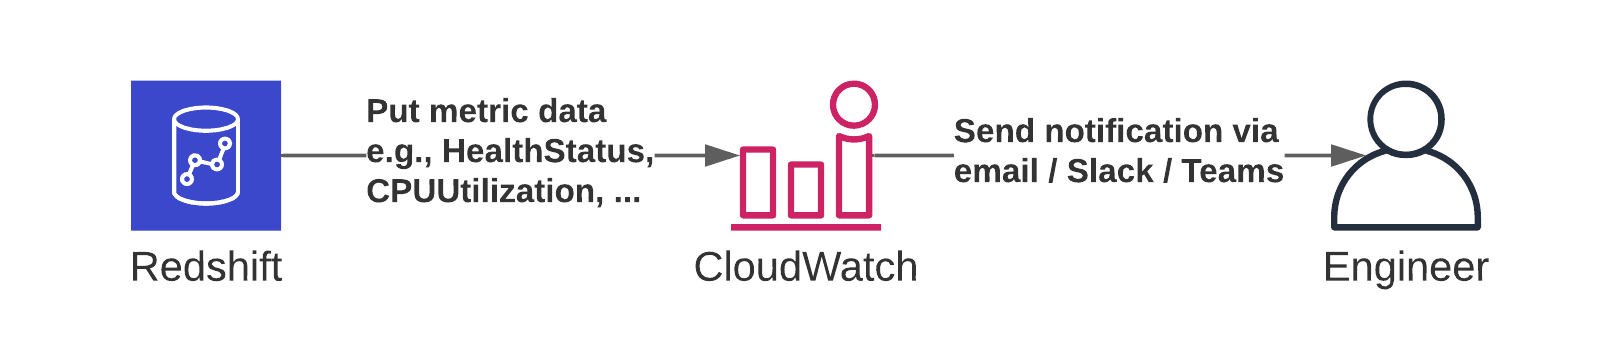
This article describes how to monitor a Redshift cluster. As most AWS services do, Redshift reports metrics to CloudWatch. Use those metrics to define alarms and get notified about issues via email, Slack, or Microsoft Teams.
Health
Most important, you should monitor the health of your Redshift cluster. Even though AWS is responsible for operating the data warehouse, you should know whenever there is an issue with your cluster. It might be necessary to contact AWS support or to restore your cluster from a snapshot.
The HealthStatus metric indicates whether your cluster is healthy. If so, the Redshift cluster reports a value of 1 every minute. Therefore, create a CloudWatch alarm that checks for a value of less than one.
From time to time, AWS will schedule a maintenance window for your Redshift cluster. The CloudWatch metric MaintenanceMode indicates when your cluster is unavailable because of maintenance work. Make sure to define a CloudWatch alarm checking for a value greater zero.
Monitoring Assistant
Ask marbot to monitor Redshift for you and receive alerts in Slack or Microsoft Teams.It couldn't be easier!
- Add marbot to Slack or Microsoft Teams.
- Invite marbot to a channel.
- Follow the setup wizard.
Quotas
The storage capacity of your Redshift cluster is limited. The smallest node types come with 160 GB storage. The biggest node type offers up to 64 TB. In both cases, you should monitor the PercentageDiskSpaceUsed metric closely. Doing so avoids that your cluster will run out of storage capacity.
As an administrator, you might want to define storage quotas for specific schemas of the data warehouse. Doing so allows you to isolate and limit different workloads running on the same Redshift cluster. The QUOTA parameter does the trick1. When defining storage quotas for schemas, you should also monitor whether a schema exceeds the quota. Therefore, I recommend creating a CloudWatch alarm verifying that the NumExceededSchemaQuotas metric does not exceed zero.
Performance
Monitoring the performance of a Redshift cluster is tricky. However, there are a few metrics that are easy to observe:
CPUUtilizationwhich indicates the utilization of the CPUReadThroughputwhich indicates the read throughput to the storage systemWriteThroughputwhich indicates the write throughput to the storage system
Of course, it is totally fine for the cluster to work at full capacity. But keep in mind that it might help to increase the node type when your data warehouse is under high load most of the time.
Costs
When spinning up a Redshift cluster, most of the monthly costs are static. But, there are a few exceptions to that rule: concurrency scaling and managed storage.
Concurrency Scaling2 is a feature that allows your Redshift cluster to scale horizontally to process requests in parallel. The feature is free for up to 60 minutes. After that, you start paying. Costs can be significant. Therefore I recommend monitoring the ConcurrencyScalingSeconds metric. It would be best if you were notified whenever the sum within 24 hours is greater than 3600.
When using nodes of type RA3, the managed storage is billed per GB up to 64 TB. The only way to monitor storage consumption is the PercentageDiskSpaceUsed metric.
Summary
In summary, I recommend to monitor the following CloudWatch metrics closely:
HealthStatusindicates the health of your Redshift cluster.MaintenanceModenotifies about ongoing maintenance.PercentageDiskSpaceUsedto monitor the remaining disk space.NumExceededSchemaQuotascheck for exceeded schema quotas.CPUUtilizationindicates the CPU utilization.ReadThroughputandWriteThroughputshows the I/O throughput to the storage system.ConcurrencyScalingSecondsto avoid unwanted costs due to concurrency scaling.
Therefore, you need to create and configure seven CloudWatch alarms per Redshift cluster.
Monitoring Assistant
Want a little help with that? Ask marbot to monitor Redshift for you and receive alerts in Slack or Microsoft Teams.It couldn't be easier!
- Add marbot to Slack or Microsoft Teams.
- Invite marbot to a channel.
- Follow the setup wizard.
Take your AWS monitoring to a new level! Chatbot for AWS Monitoring: Configure monitoring, escalate alerts, solve incidents.

Michael Wittig
Consultant focusing on Amazon Web Services (AWS). Entrepreneur building marbot.io. Author of Amazon Web Services in Action, Rapid Docker on AWS, and cloudonaut.io.
You can contact me via Email, Twitter, and LinkedIn.
Published on