How To Monitor a Serverless Application
Andreas Wittig – 17 Aug 2018
Compared to a typical web application deployed to EC2 a Serverless Application - consisting of an API Gateway and a Lambda function - needs less monitoring as you are outsourcing most of the operations to AWS. However, there are still some metrics you should keep an eye on. This article shows you how to monitor a Serverless Application with CloudWatch.
Typically a Serverless Application consists of an API Gateway forwarding incoming requests to Lambda. Lambda executes your business logic and makes use of S3 to store objects, DynamoDB to store and query data, and SES to send emails, for example. The following figure illustrates the architecture and shows which CloudWatch metrics need your attention.
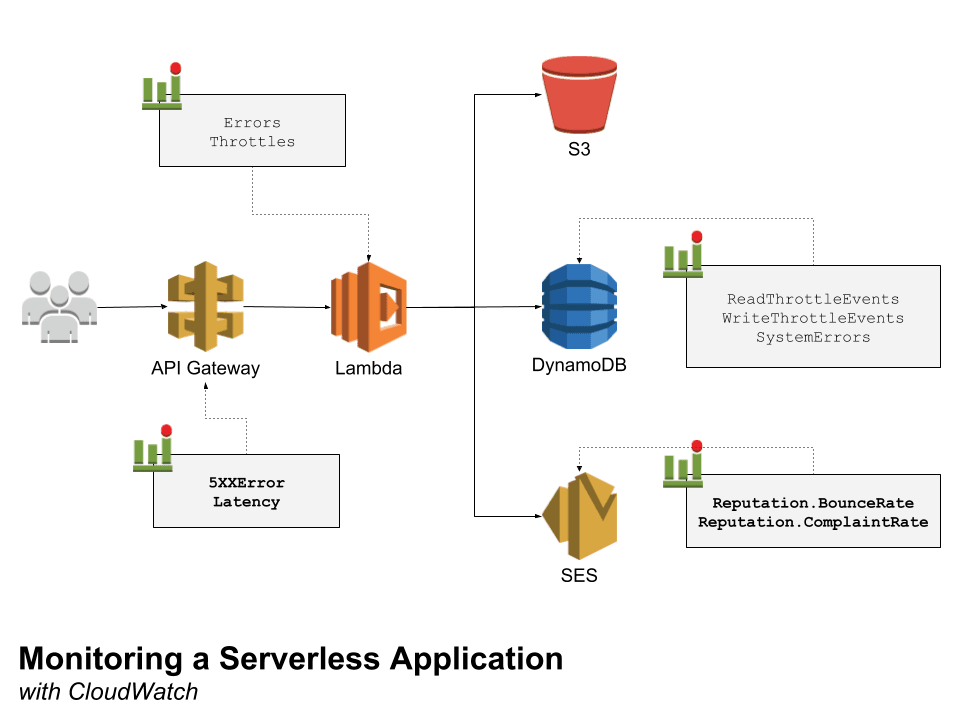
You should create a CloudWatch dashboard showing all metrics and define CloudWatch alarms for all highlighted metrics.
| Namespace | Metric Name | Description |
|---|---|---|
| AWS/ApiGateway | 5XXError | Number of requests with status code 5XX (server-side error). |
| AWS/ApiGateway | Latency | Time between incoming request and response on API Gateway. |
| AWS/Lambda | Errors | Number of failed function invocations (e.g. timeout, exception, …). |
| AWS/Lambda | Throttles | Number of throttled function invocations. |
| AWS/DynamoDB | ReadThrottleEvents | Number of throttled read requests. |
| AWS/DynamoDB | WriteThrottleEvents | Number of throttled read requests. |
| AWS/DynamoDB | SystemErrors | Number of server-side errors. |
| AWS/SES | Reputation.BounceRate | Percentage of bounced messages (multiply by 100). |
| AWS/SES | Reputation.ComplaintRate | Percentage of messages reported as spam (multiply by 100). |
Start with the following configuration for your CloudWatch alarms. Don’t forget to refine the thresholds after a few days. To get notified about server-side errors typically resulting in error messages for your users you should create the following metric:
- Metric namespace:
AWS/ApiGateway - Metric name:
5XXError - Metric dimension:
ApiNameand optionalStage - Metric period:
60 seconds - Number of periods:
5or1 out of 5 - Statistic:
Sum - Alarm condition:
> 1
Additionally, you should not miss when your users are experiencing long waiting times caused by high latencies of your Serverless Application.
- Metric namespace:
AWS/ApiGateway - Metric name:
Latency - Metric dimension:
ApiNameand optionalStage - Metric period:
60 seconds - Number of periods:
5or1 out of 5 - Statistic:
p90,p95, orp95(depending on number of requests) - Alarm condition:
> 500ms
You don’t need to create CloudWatch alarms for the metrics of Lambda, S3, and DynamoDB as problems with all of these components result in a 5XX error or high latencies at the API Gateway. Instead of creating CloudWatch alarms for these metrics put them on a CloudWatch dashboard to simplify investigating issues.
When sending emails with SES, you should create the following CloudWatch alarms to make sure you get notified when there is a problem with your reputation as a sender. Create the following alarm to get notified when the bounce rate is too high.
- Metric namespace:
AWS/SES - Metric name:
Reputation.BounceRate - Metric dimension: depends on your event destination configuration
- Metric period:
900 seconds - Number of periods:
5or1 out of 5 - Statistic:
Maximum - Alarm condition:
> 0.05
Next, add one more alarm to get notified about spam complaints as well.
- Metric namespace:
AWS/SES - Metric name:
Reputation.ComplaintRate - Metric dimension: depends on your event destination configuration
- Metric period:
900 seconds - Number of periods:
5or1 out of 5 - Statistic:
Maximum - Alarm condition:
> 0.05
That’s it. You are monitoring your Serverless Application closely and are ready to investigate potential issues.
Take your AWS monitoring to a new level! Chatbot for AWS Monitoring: Configure monitoring, escalate alerts, solve incidents.

Andreas Wittig
Consultant focusing on Amazon Web Services (AWS). Entrepreneur building marbot.io. Author of Amazon Web Services in Action, Rapid Docker on AWS, and cloudonaut.io.
You can contact me via Email, Twitter, and LinkedIn.
Published on