The simplest way to monitor a web application on AWS
Andreas Wittig – 30 Jul 2018
Is CloudWatch sending alarms when the CPU utilization of your EC2 instances is above 80%? Are you monitoring the memory usage on your RDS instances as well? That’s a massive waste of energy! You only need to notify yourself or your team if the customers of your application are affected by a failure or if the application is running into a failure state it cannot resolve itself. I call it customer-centric monitoring. Typically, you do not need to monitor more than eight metrics for a regular web application.
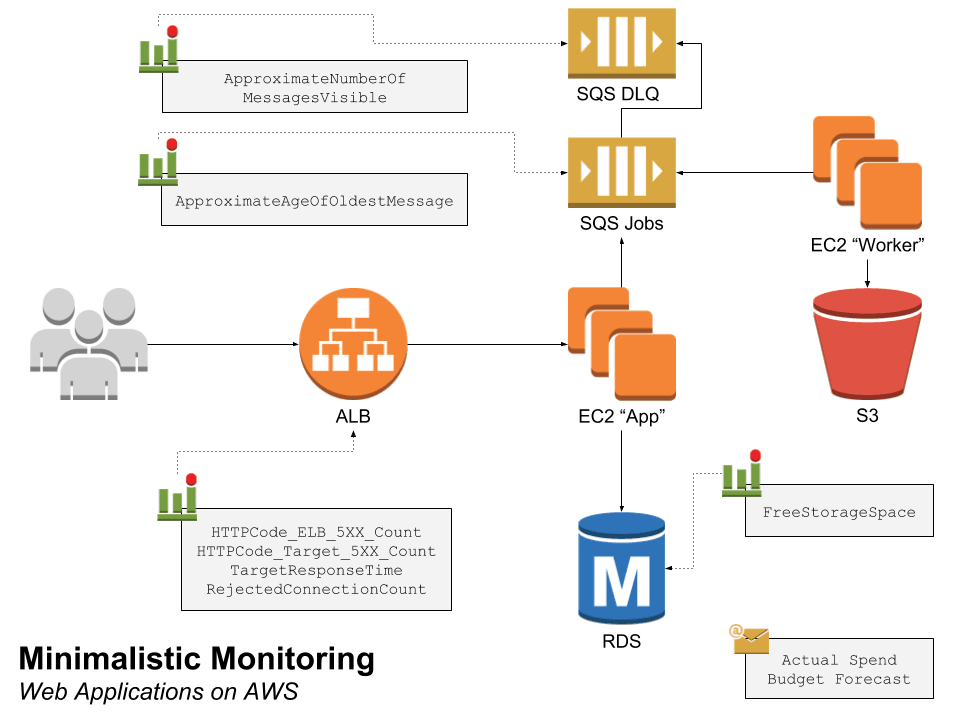
The following figure shows the minimal monitoring setup for a web application on AWS:
- Application Load Balancer (ALB): the number 5XX errors, the latency, as well as the rejected connections.
- Relational Database Service (RDS): the free storage space.
- Simple Queuing Service (SQS): the age of the oldest message in the jobs queue as well as the length of the dead-letter queue.
- Budget: the actual and forecasted costs.
Monitoring the Application Load Balancer (ALB)
From a customer’s point of view, the ALB is the entry point into your infrastructure. As a consequence, the load balancer knows a lot about the health of your application.
Server Errors (5XX)
A 5XX response status code indicates that the server was not able to answer an incoming request. Typically, a 5XX error results in an error message shown to your customer. Two CloudWatch alarms are needed to get notified about 5XX server errors.
Whenever your load balancer is not able to forward an incoming request to one of the EC2 instances it generates and returns a 5XX error to the client. For example, when there is no healthy EC2 instance registered at your load balancer. Create a CloudWatch alarm based on the following details to get notified about 5XX server errors generated by the load balancer.
- Metric namespace:
AWS/ApplicationELB - Metric name:
HTTPCode_ELB_5XX_Count - Metric dimension:
LoadBalancer - Metric period:
1 minute - Number of periods:
5or1 out of 5 - Statistic:
Sum - Alarm condition:
> 1
Not only the load balancer is generating 5XX errors, but your application is doing so as well. For example, when your application is not able to access the RDS database. Therefore, you need to create another CloudWatch alarm with the following configuration details:
- Metric namespace:
AWS/ApplicationELB - Metric name:
HTTPCode_Target_5XX_Count - Metric dimension:
LoadBalancer - Metric period:
1 minute - Number of periods:
5or1 out of 5 - Statistic:
Sum - Alarm condition:
> 1
You are not done monitoring your load balancer yet.
Latency
A server-side error is not the only way to upset a customer. Long waiting times, also known as high latencies, are a source of customer dissatisfaction as well. That is why you should monitor the latency between your load balancer and your application running on EC2 instances as well.
To do so, create an alarm with the following details:
- Metric namespace:
AWS/ApplicationELB - Metric name:
TargetResponseTime - Metric dimension:
LoadBalancer - Metric period:
1 minute - Number of periods:
5or1 out of 5 - Statistic:
p99orAverageif there are less than 1000 requests per minute - Alarm condition:
> 0.2seconds
Your load balancer is providing one more metric, that you should monitor
closely.
Rejected connections
The ALB scales automatically. However, when the number of new connections increases very quickly, the ALB might not be able to scale fast enough. In this case, new requests are rejected, and your customers are not able to access your application at all. So, that is a good reason to monitor for rejected connections as well.
- Metric namespace:
AWS/ApplicationELB - Metric name:
RejectedConnectionCount - Metric dimension:
LoadBalancer - Metric period:
1 minute - Number of periods:
5or1 out of 5 - Statistic:
Sum - Alarm condition:
> 1
EC2 Instances: App
You don’t need to monitor the EC2 instances which your application is running on. All failure conditions are resulting in 5XX errors or high latencies which you are monitoring at the load balancer already.
Relational Database Service (RDS)
By using RDS, you have outsourced the challenges of operating a relational database to AWS. The only task that is left is to monitor the available resources for each database instance. When your database lacks CPU, memory, I/O or network capacity, this will result in high latencies or even server errors. You are already monitoring the ALB to detect these kinds of issues.
But what happens if your database instance is running out of free storage space? Your database will fail and might even loose or corrupt data. So you better create a CloudWatch alarm to make sure you will never run out of storage:
- Metric namespace:
AWS/RDS - Metric name:
FreeStorageSpace - Metric dimension:
DBInstanceIdentifier - Metric period:
1 minute - Number of periods:
5or1 out of 5 - Statistic:
Minimum - Alarm condition:
< 1000000000Bytes
Sidenote: The database engine Aurora does not require you to provision storage capacity in advance. The size of the storage grows on-demand. Consequently, you don’t need to monitor the FreeStorageSpace metric if you are using the Aurora database engine.
Let’s have a look at another part of your application next: asynchronous batch processing.
Simple Queuing Service (SQS)
Your customers will get nervous when batch jobs like generating reports, sending order confirmations, or publishing content are failing. An alarm monitoring the age of the oldest message in your SQS queue will do the trick.
- Metric namespace:
AWS/SQS - Metric name:
ApproximateAgeOfOldestMessage - Metric dimension:
QueueName - Metric period:
5 minutes - Number of periods:
5or1 out of 5 - Statistic:
Maximum - Alarm condition:
< 500seconds
Typically for each job queue, you create a dead-letter queue (DLQ) as well. When your workers fail to process a job from the queue for multiple times, the job is removed from the job queue and added to the DLQ. Therefore, you should also monitor the length of the DLQ.
- Metric namespace:
AWS/SQS - Metric name:
ApproximateNumberOfMessagesVisible - Metric dimension:
QueueName - Metric period:
5 minutes - Number of periods:
5or1 out of 5 - Statistic:
Maximum - Alarm condition:
> 0
EC2 Instances: Worker
It is not necessary to monitor the EC2 instances running the workers processing the jobs from the queue. When the workers fail or there are not enough resources available, one of the alarms on SQS queues will trigger.
Finally, you should monitor the money your infrastructure is burning every day.
Budget
Although, there is a CloudWatch metric estimating the charges for the current month. I prefer using AWS Budgets to monitor costs because of the possibility send alarms based on the actual spend until the current day of the month as well as the forecasted spend projected on the end of the month.
Summary
The minimal monitoring setup for a web application on AWS consists of eight alarms:
- ALB: 5XX errors generated by the load balancer
- ALB: 5XX errors originating from the application running on EC2 instances
- ALB: latency from the load balancer to the application running on EC2 instances
- ALB: rejected connections caused by an overload of the load balancer
- RDS: free storage space
- SQS: age of oldest message in the jobs queue
- SQS: number of messages in the dead-letter queue
- Budget: current and forecasted costs
Take your AWS monitoring to a new level! Chatbot for AWS Monitoring: Configure monitoring, escalate alerts, solve incidents.

Andreas Wittig
Consultant focusing on Amazon Web Services (AWS). Entrepreneur building marbot.io. Author of Amazon Web Services in Action, Rapid Docker on AWS, and cloudonaut.io.
You can contact me via Email, Twitter, and LinkedIn.
Published on