Monitor CloudFront with CloudWatch metrics and alarms
Michael Wittig – 18 Aug 2020 (updated 17 Aug 2021)
CloudFront and S3 power this website. On top of that, we are using Lambda@Edge to resize images on the fly. AWS is responsible for the availability and scalability of all three services. Therefore, operating the infrastructure for our website is not too complicated. However, there are still a few things that can go wrong that we want to monitor. Learn how to use CloudWatch metrics and alarms to monitor CloudFront in the following.

Monitoring with CloudWatch
Monitoring with CloudWatch is a four-step process:
- Understanding the architecture and identify used AWS services.
- Select CloudWatch metrics that are best suited to indicate a system in trouble.
- Create CloudWatch alarms to watch if the metrics stay within healthy bounds.
- Receive alerts to start an incident management and escalation process if a CloudWatch alarm detects a metric outside the threshold.
Monitoring Assistant
Are you in a hurry? Ask marbot to monitor CloudFront for you and receive alerts in Slack or Microsoft Teams.It couldn't be easier!
- Add marbot to Slack or Microsoft Teams.
- Invite marbot to a channel.
- Follow the setup wizard.
Understanding the architecture
When using CloudFront, your architecture looks similar to the following diagram.
- CloudFront, the Content Delivery Network.
- S3 or ELB, the origins of your content.
- Lambda@Edge (optional),
- CloudWatch collects metrics from all AWS services.
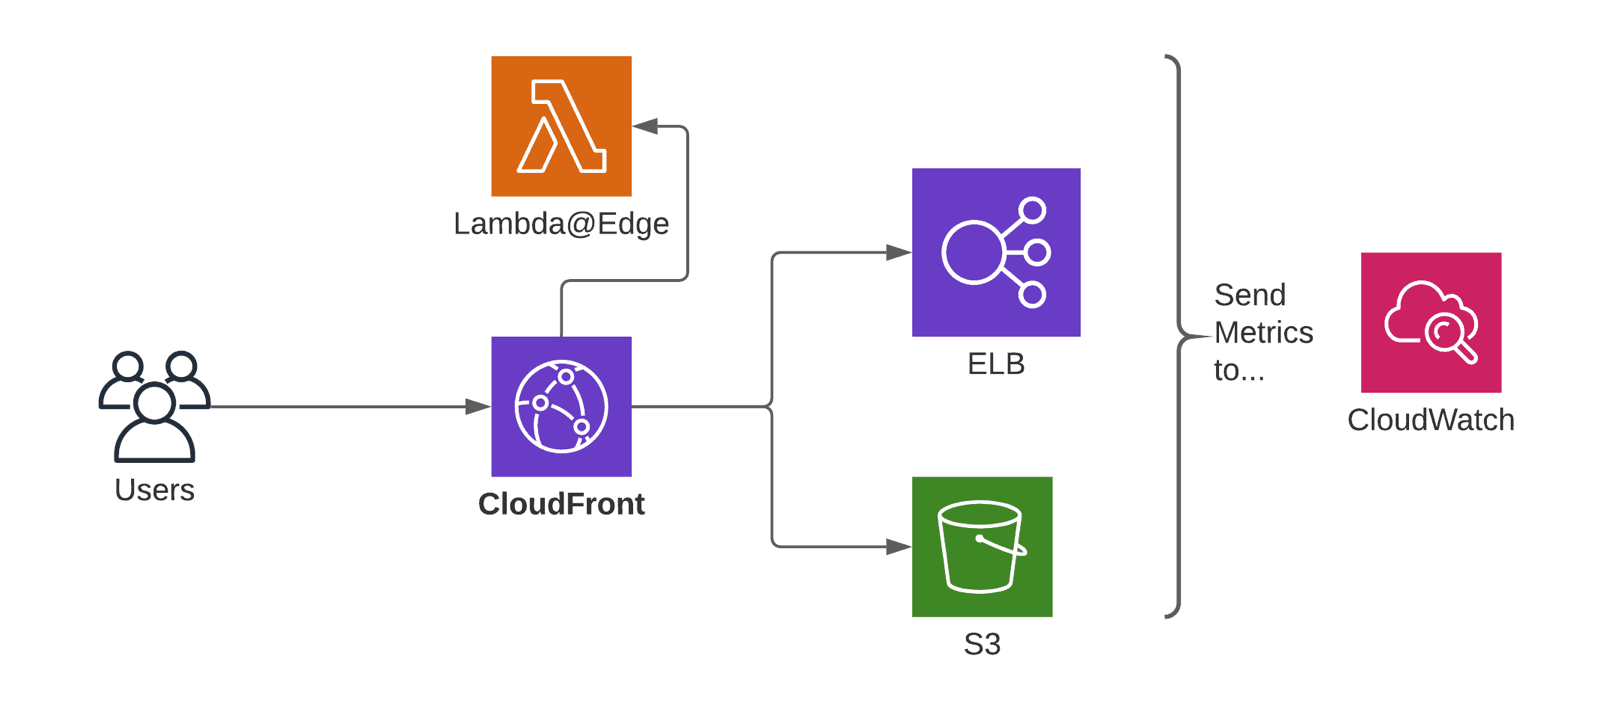
The key point is that CloudFront automatically reports metrics to CloudWatch. But it is your job to create CloudWatch alarms to monitor the right metrics.
One CloudWatch metric tells you if your origin is in troubles
By default, each CloudFront distribution reports six default metrics for free. Only one metric is crucial to understand the health of your CloudFront distribution. The 5xxErrorRate. The percentage of all requests answered with a 5xx aka server error response.
- CloudFront returns 502 if your origin (e.g., S3 or ELB) does not accept traffic on the configured port or if your origin’s TLS/SSL configuration is broken.
- 503 is returned when the origin server is overwhelmed with incoming requests.
- A 504 indicates that your origin did not respond within the configured origin response timeout.
What about the 4xxErrorRate? The percentage of all requests answered with a 4xx aka client error response. 4xx errors are caused by the client sending invalid, malformed, unauthorized requests. You should not be alerted if clients do crazy things that you can not stop.
If you see an uptick in 5xx errors, your origin is in trouble, and your users suffer. The
5xxErrorRatemakes 5xx errors visible.
Advanced monitoring with additional CloudWatch metrics
In December 2019, AWS announced eight additional metrics for CloudFront.
| Metric | Description |
|---|---|
| CacheHitRate | The percentage of all cacheable requests (successful GET, HEAD, and OPTIONS requests) served from CloudFront's cache and not the origin. |
| OriginLatency | Latency from CloudFront to the origin and back, aka first-byte latency, or time-to-first-byte. |
The CacheHitRate is worth monitoring. If you usually cache 60% of the requests, you likely run into issues when the hit rate drops to 30%. Remember that a lower hit rate increases end-user latency and the load on your backend. You should also carefully monitor the OriginLatency to notice backend performance issued before CloudFront times out or your users suffer from long page load times.
On top of that, AWS splits down the 4xx and 5xx error rates into more detailed metrics:
401ErrorRate403ErrorRate404ErrorRate502ErrorRate503ErrorRate504ErrorRate
The additional error rate metrics are great for debugging but not crucial for monitoring.
You have to enable advanced monitoring for your CloudFront distributions manually. Unfortunately, CloudFormation misses support for advanced monitoring. Terraform has you covered. Check out the following video to learn how to enable advanced metrics in the AWS UI.
Please note, enabling advanced metrics costs about $2.40 per month for each CloudFront distribution.
Creating CloudWatch alarms
I recommend monitoring the following CloudWatch metrics with alarms:
5xxErrorRateshows the number of failed requests resulting in an error message visible to the user. If this metric goes above 0, your system is in trouble.CacheHitRateindicates how many requests are answered from the cache instead of contacting the origin. A healthy cache hit ratio depends on your application. I recommend setting the threshold to a reasonable value from the past. You can also use CloudWatch’s anomaly detection to train the threshold automatically.OriginLatencyreports the latency from CloudFront to the origin (e.g., S3 or ELB). I would go with a historical value or anomaly detection as well.
To monitor the metrics, you need to create and configure five CloudWatch alarms per CloudFront distribution.
Monitoring Assistant
Are you bored of creating CloudWatch alarms? Ask marbot to do it for you!It couldn't be easier!
- Add marbot to Slack or Microsoft Teams.
- Invite marbot to a channel.
- Follow the setup wizard.
Are you using Lambda@Edge?
Lambda@Edge allows you to run your code at the edge locations, where CloudFront is deployed. Typical use cases for Lamdba@Edge: request or response manipulation (e.g., redirects) or on-the-fly image resizing.
Adding Lambda and your code to the mix increases the chance that things will go wrong. Therefore, it is essential to monitor the following metrics with CloudWatch alarms:
LambdaExecutionErrorcounts the number of failed Lambda executions. If this metric goes above 0, your system is in trouble.LambdaValidationErrorcounts the number of invalid responses from Lambda. If this metric goes above 0, your system is in trouble.
Receiving alerts
A CloudWatch alarm triggers an action if the defined threshold is reached. Usually, the action published a message to an SNS topic.
Monitoring Assistant
Are you interested in receiving alerts in Slack or Microsoft Teams?It couldn't be easier!
- Add marbot to Slack or Microsoft Teams.
- Invite marbot to a channel.
- Follow the setup wizard.
To receive the alert, you have to subscribe to that SNS topic via email, SMS, or a webhook.
Take your AWS monitoring to a new level! Chatbot for AWS Monitoring: Configure monitoring, escalate alerts, solve incidents.

Michael Wittig
Consultant focusing on Amazon Web Services (AWS). Entrepreneur building marbot.io. Author of Amazon Web Services in Action, Rapid Docker on AWS, and cloudonaut.io.
You can contact me via Email, Twitter, and LinkedIn.
Published on and updated on