RDS Performance Insights: monitor and debug database performance
Michael Wittig – 07 Sep 2020
When users complain about a web or enterprise application’s slow response times, the root cause is often high load on the database. Usually, a high load is caused by an increased number of queries or many costly database queries.
Amazon RDS is one of the most valuable services for classic three-tier architectures. The fully managed service covers most of the tricky parts of operating a MySQL/PostgreSQL/MS SQL/Oracle database - replication to a 2nd data center, snapshots, and patch management, for example.
However, RDS is a black box. That’s fine from the one hand but makes it challenging to debug performance problems on the other hand. The optional feature called Performance Insights tackles that problem.

What is RDS Performance Insights?
RDS Performance Insights is an optional feature that you can enable for most types of RDS databases.1 The goals of the tool are:
- Debug performance issues, for example, by identifying queries that are causing high load.
- Tuning performance by identifying bottlenecks like CPU or I/O throughput.
- Monitor the performance by aggregating the core performance indicators of your database.
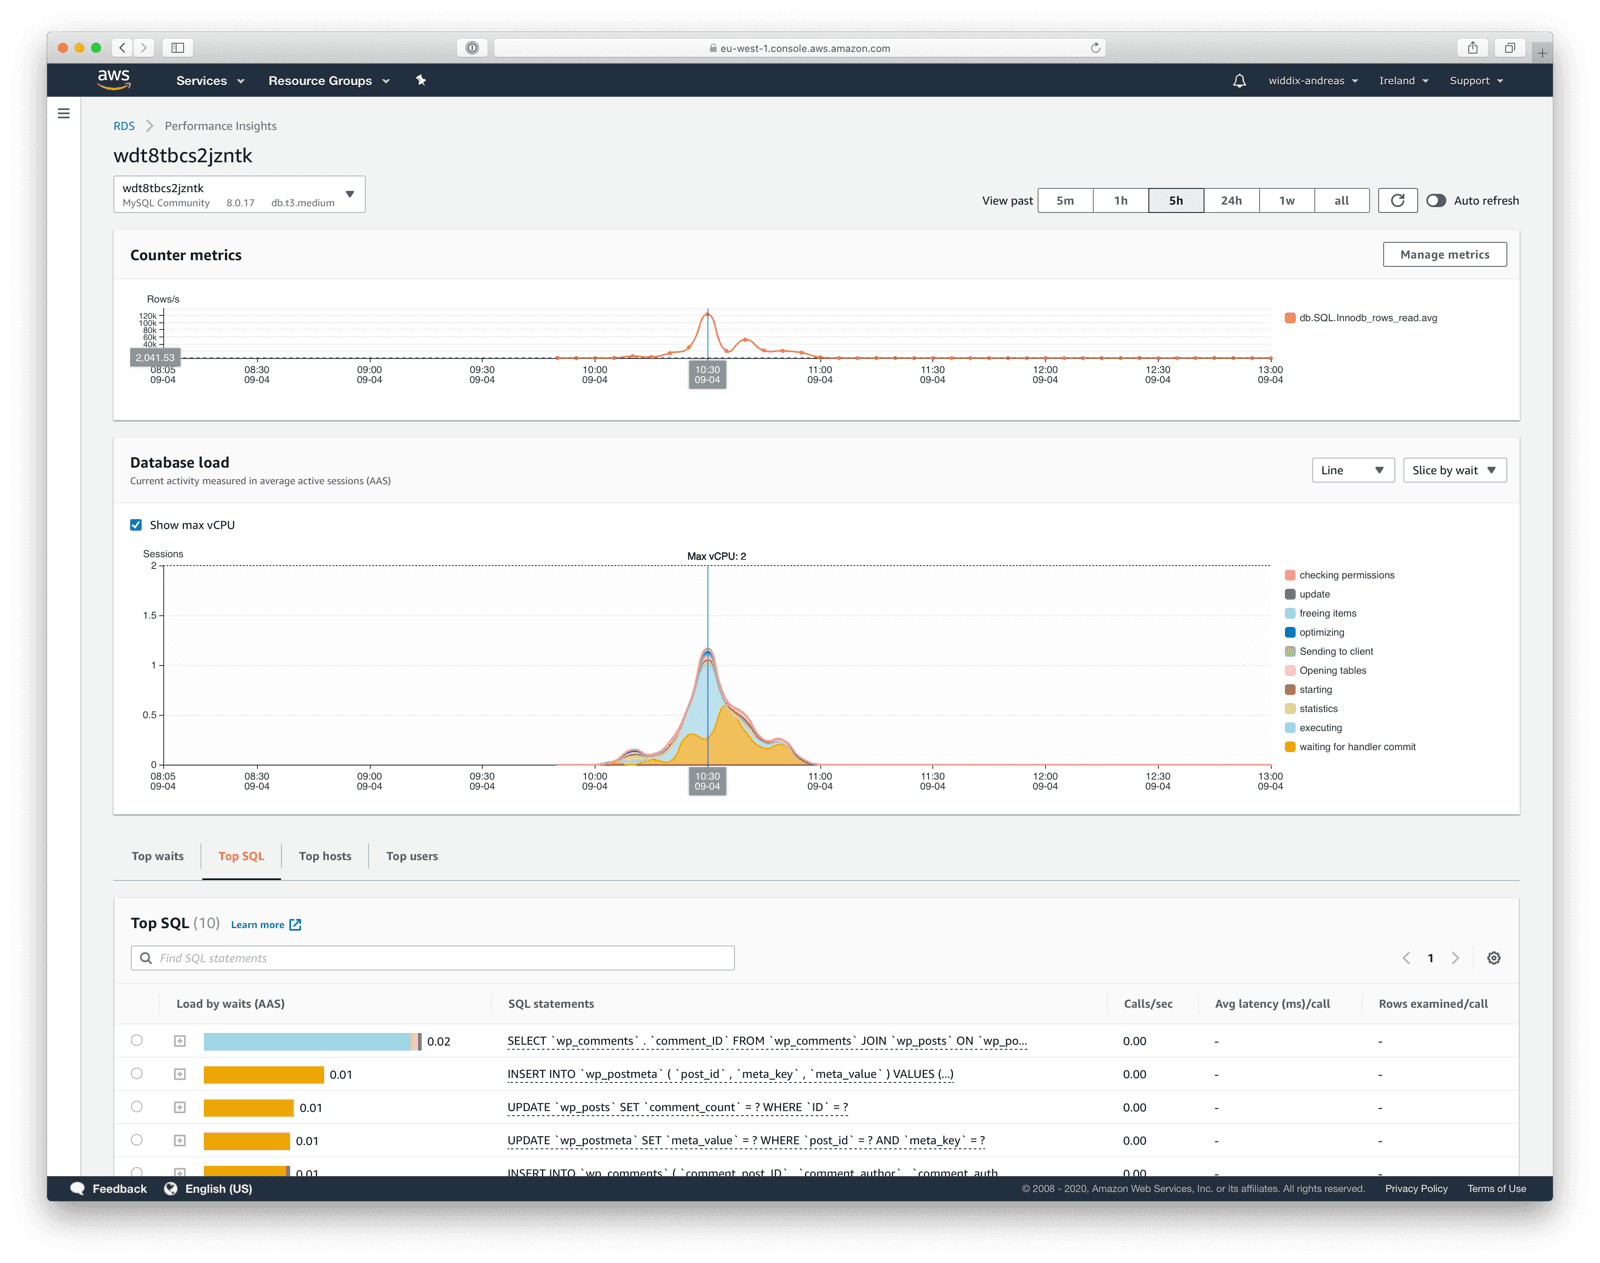
After enabling RDS Performance Insights, data is recorded in the background. There are three ways to access performance data:
The following screenshot shows RDS Performance Insights in the AWS Management Console.
Pricing
The basic version of RDS Performance Insights is free. The free tier includes seven days of performance data history and one million API requests per month. Therefore, you should enable RDS Performance Insights by default. Keep in mind that not all database engines support RDS Performance Insights for the small instance types.1
Enabling long term data retention (up to two years) is quite expensive. Monthly costs vary from $5 to $497, depending on the instance type.4
Counter Metrics
RDS Performance Insights records counter metrics helping you to understand what is going on in your database. The tracked metrics differ between the different database engine types. A few examples for a MySQL database:
| Metric | Description |
|---|---|
| os.cpuUtilization.total | The total percentage of the CPU in use. This value includes the nice value. |
| os.diskIO.await | The number of milliseconds required to respond to requests, including queue time and service time. |
| db.SQL.Slow_queries | The number of queries that have taken more than long_query_time seconds. |
| db.SQL.Innodb_rows_inserted | The number of rows inserted into InnoDB tables. |
| db.SQL.Innodb_rows_read | The number of rows read from InnoDB tables. |
| db.SQL.Innodb_rows_updated | The number of rows updated in InnoDB tables. |
| db.SQL.Innodb_rows_deleted | The number of rows deleted from InnoDB tables. |
Open RDS Performance Insights in the AWS Management Console and use the button Manage metrics to select the counter metrics you are interested in.
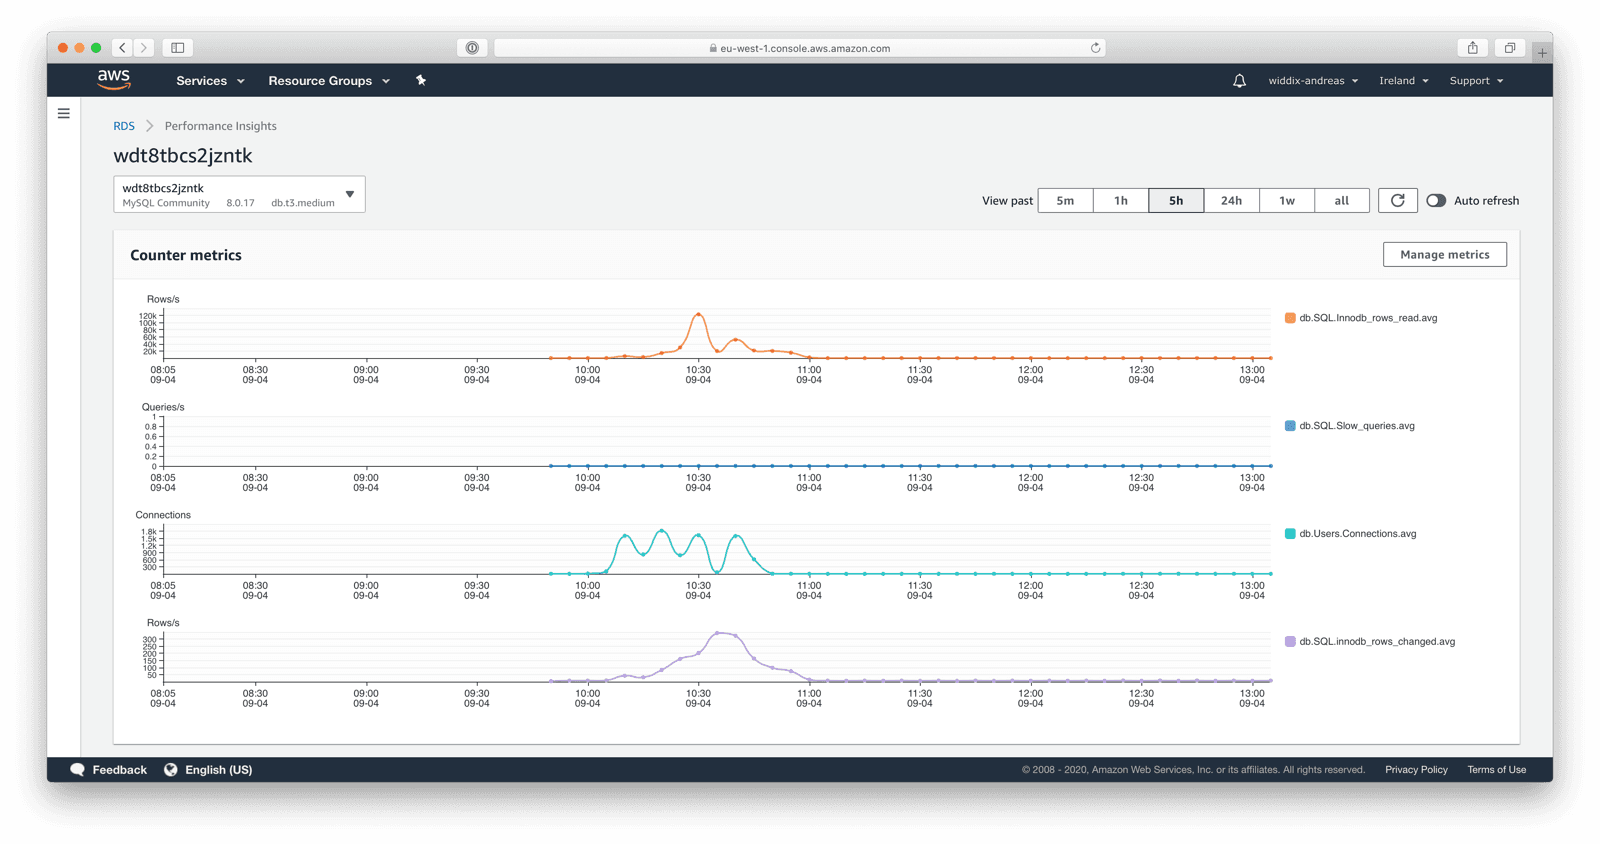
Check out Customizing the Performance Insights Dashboard to learn about all the available counter metrics. The counter metrics are accessible via the AWS Management Console and the REST API.
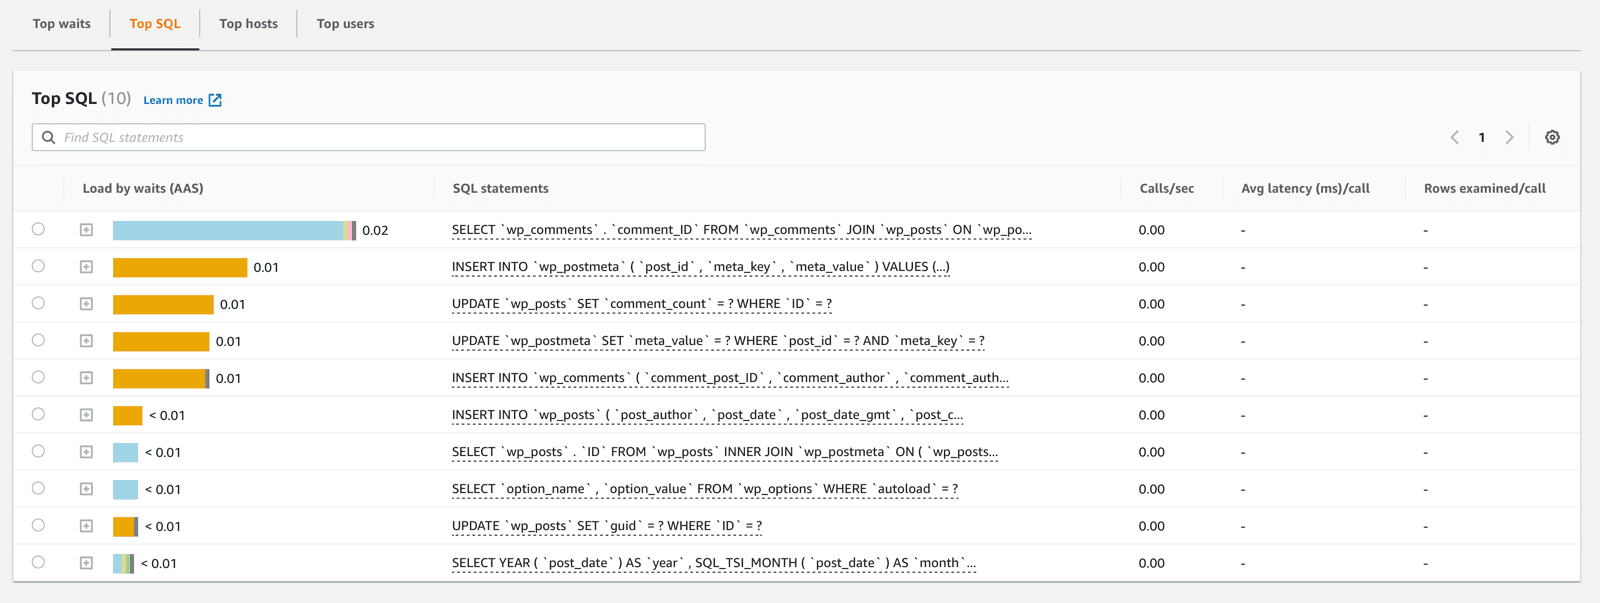
Analyze Queries
Besides that, RDS Performance Insights shows the metrics with the highest impact on the database load. This overview allows you to indicate expensive queries. Modifying the data schema, adding indexes, or reworking the queries could solve your performance issues.
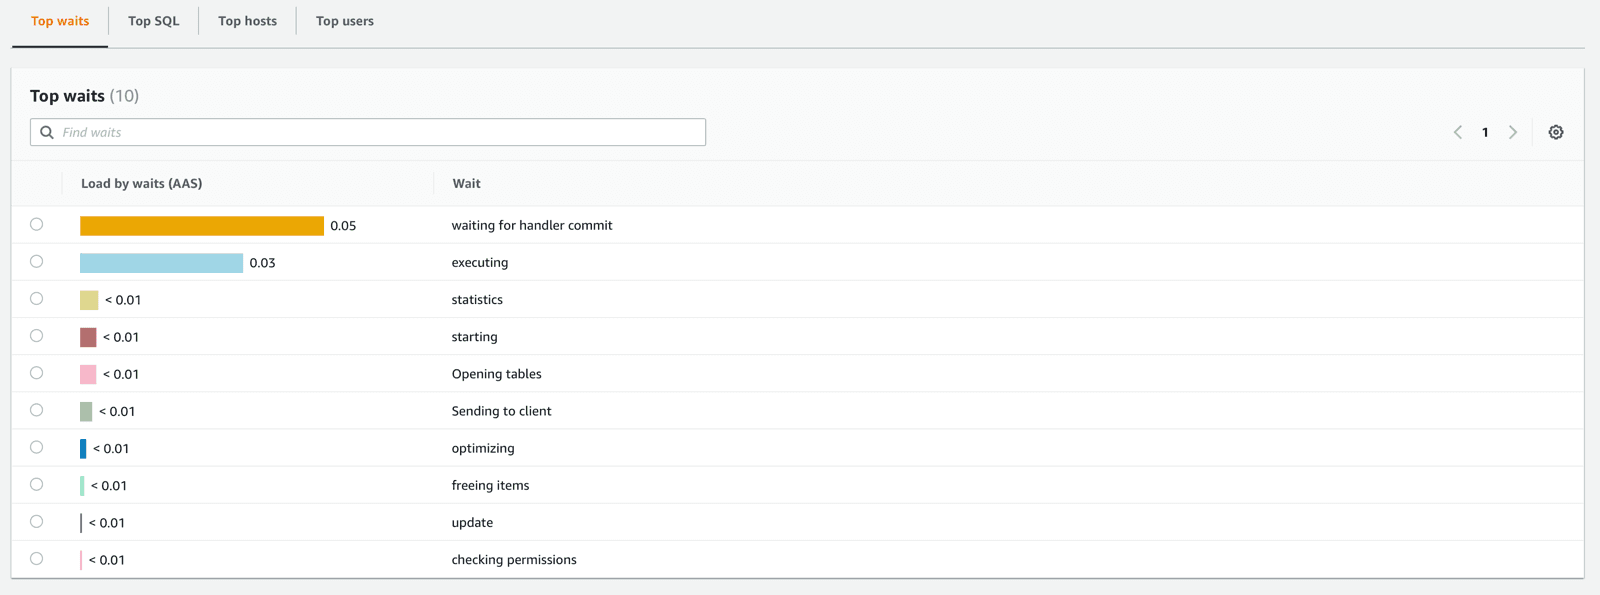
Analyze Bottlenecks
On top of that, RDS Performance Insights enables you to identify resource bottlenecks. For example, a database waiting for I/O a lot would benefit from increasing the maximum I/O throughput by switching from gp2to io1 storage.
Monitoring
RDS Performance Insights publishes data to CloudWatch as well. Those metrics can be used to monitor the load of your database with the help of CloudWatch alarms.
DBLoadthe number of average active sessions.DBLoadCPUthe number of average active sessions waiting for the CPU.DBLoadNonCPUthe number of average active sessions waiting for something else than the CPU.
Whenever the number of average active sessions exceeds the number of vCPUs of your database instance, the connections compete for resources, which increases query latencies.
Therefore, I do recommend to create a CloudWatch alarm to monitor the DBLoad metric.
- Enable RDS Performance Insights for your database.
- Add marbot to Slack or Microsoft Teams.
- Invite marbot to a channel.
- Send
@marbot monitor rdsto the channel. - marbot will help you to configure CloudWatch alarms with the help of CloudFormation.
- When creating the CloudFormation stack …
- Set the
DBInstanceIdentifierparameter to the identifier of your RDS instance. - Make sure to set the
DBLoadThresholdto the number of vCPUs of your database instance. - Review the threshold parameters.
- Save by clicking the Create button.
- marbot will notify you about issues with your RDS database.
Summary
If you haven’t done so already, you should enable RDS Performance Insights for your RDS database instances. The free version with a retention period of 7 days is sufficient for most scenarios.
- https://docs.aws.amazon.com/AmazonRDS/latest/UserGuide/USER_PerfInsights.Overview.html#USER_PerfInsights.Overview.Engines ↩
- https://docs.aws.amazon.com/AmazonRDS/latest/UserGuide/USER_PerfInsights.Cloudwatch.html ↩
- https://docs.aws.amazon.com/AmazonRDS/latest/UserGuide/USER_PerfInsights.API.html ↩
- https://aws.amazon.com/rds/performance-insights/pricing/ ↩
Take your AWS monitoring to a new level! Chatbot for AWS Monitoring: Configure monitoring, escalate alerts, solve incidents.

Michael Wittig
Consultant focusing on Amazon Web Services (AWS). Entrepreneur building marbot.io. Author of Amazon Web Services in Action, Rapid Docker on AWS, and cloudonaut.io.
You can contact me via Email, Twitter, and LinkedIn.
Published on