CloudWatch Tips and Tricks: Monitoring Error Metrics
Andreas Wittig – 09 Aug 2018
Whenever you need to have a look into these black boxes, they call the Amazon cloud, go to Amazon CloudWatch directly. This post is the first part of a tips and tricks series guiding you through monitoring your AWS resources.

Some metrics contain data points for every minute or five minutes, depending on the metric’s resolution. For example, the CPU utilization metric of an EC2 instance contains a data point every minute, when detailed monitoring is enabled.
However, other metrics only contain data points when something goes wrong. I call them error counting metrics. For example, the errors metric of a Lambda function only contains a data point when the execution of the function failed.
As illustrated in the following figure, when you define a metric to get notified whenever an error occurs during the execution of your Lambda function you end up with an alarm in state INSUFFICIENT_DATA.
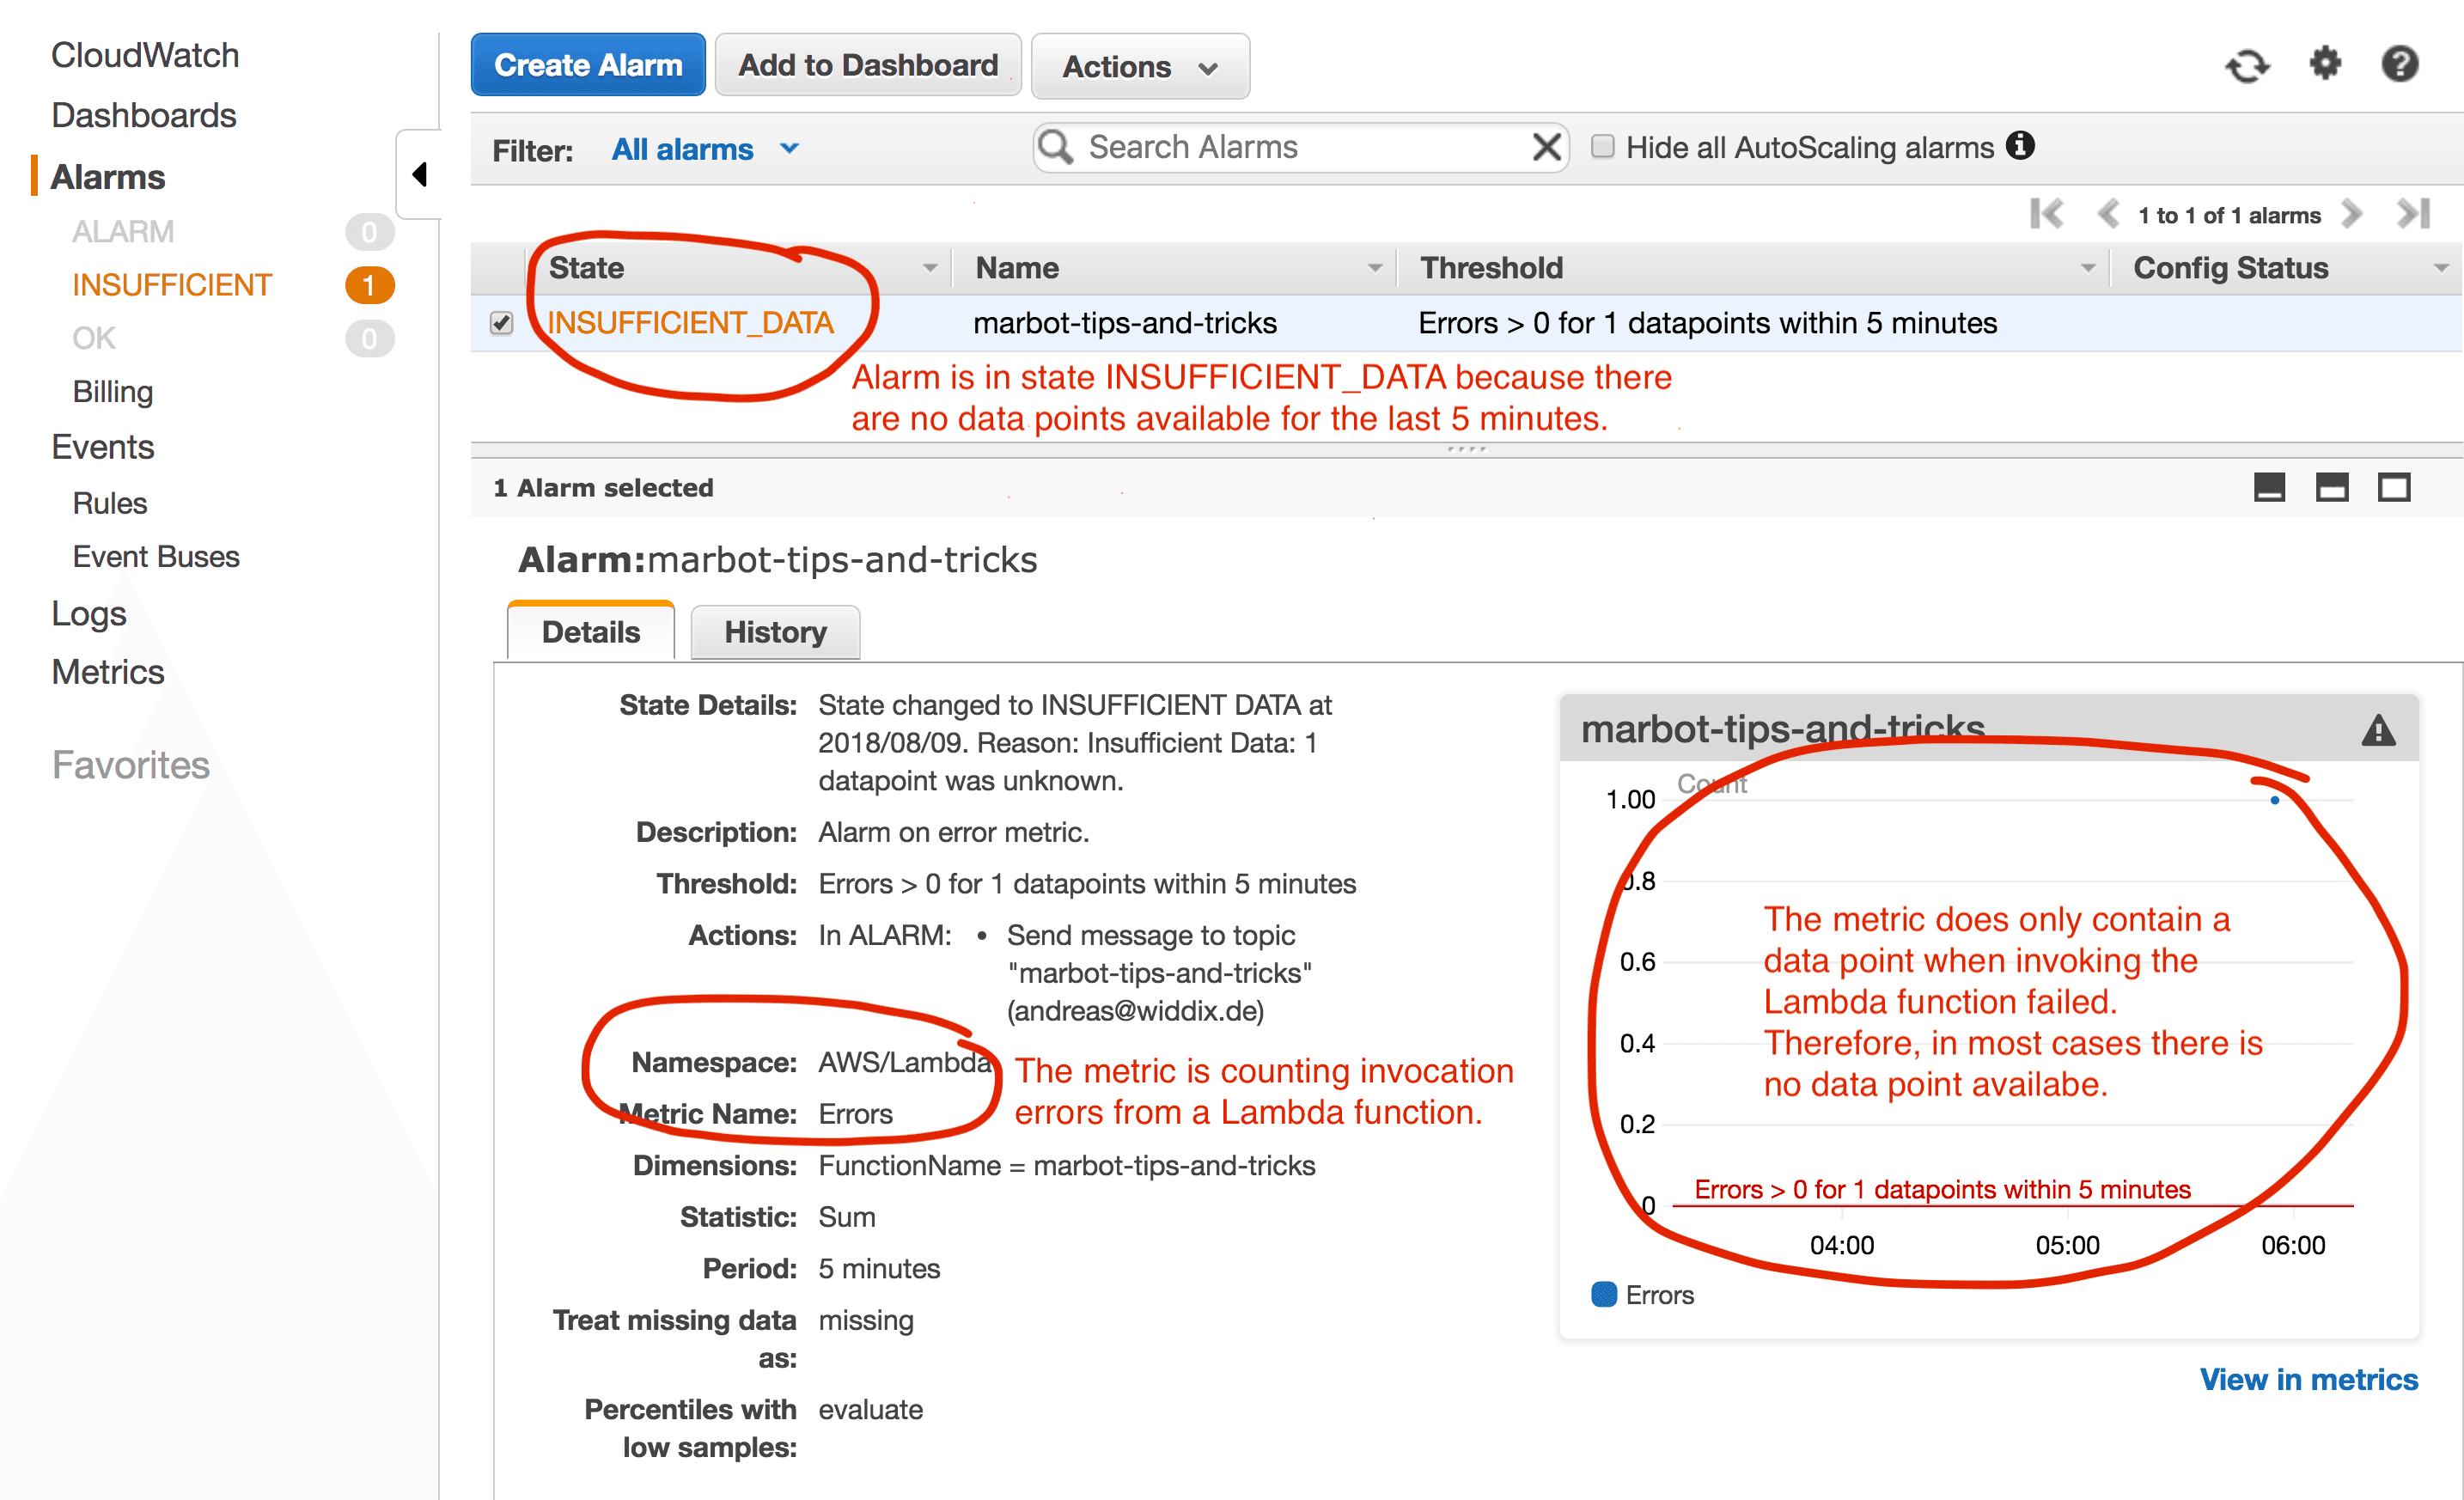
Why is that? Because the Errors metric of your Lambda function does not contain any data points as long as all invocations succeed. By default, the CloudWatch alarm does not know whether missing data points are a good or a bad sign. That’s why the CloudWatch alarm changes state to INSUFFICIENT_DATA. As missing data points are a good sign with error counting metrics how do you make sure the alarm changes from INSUFFICIENT_DATA to OK?
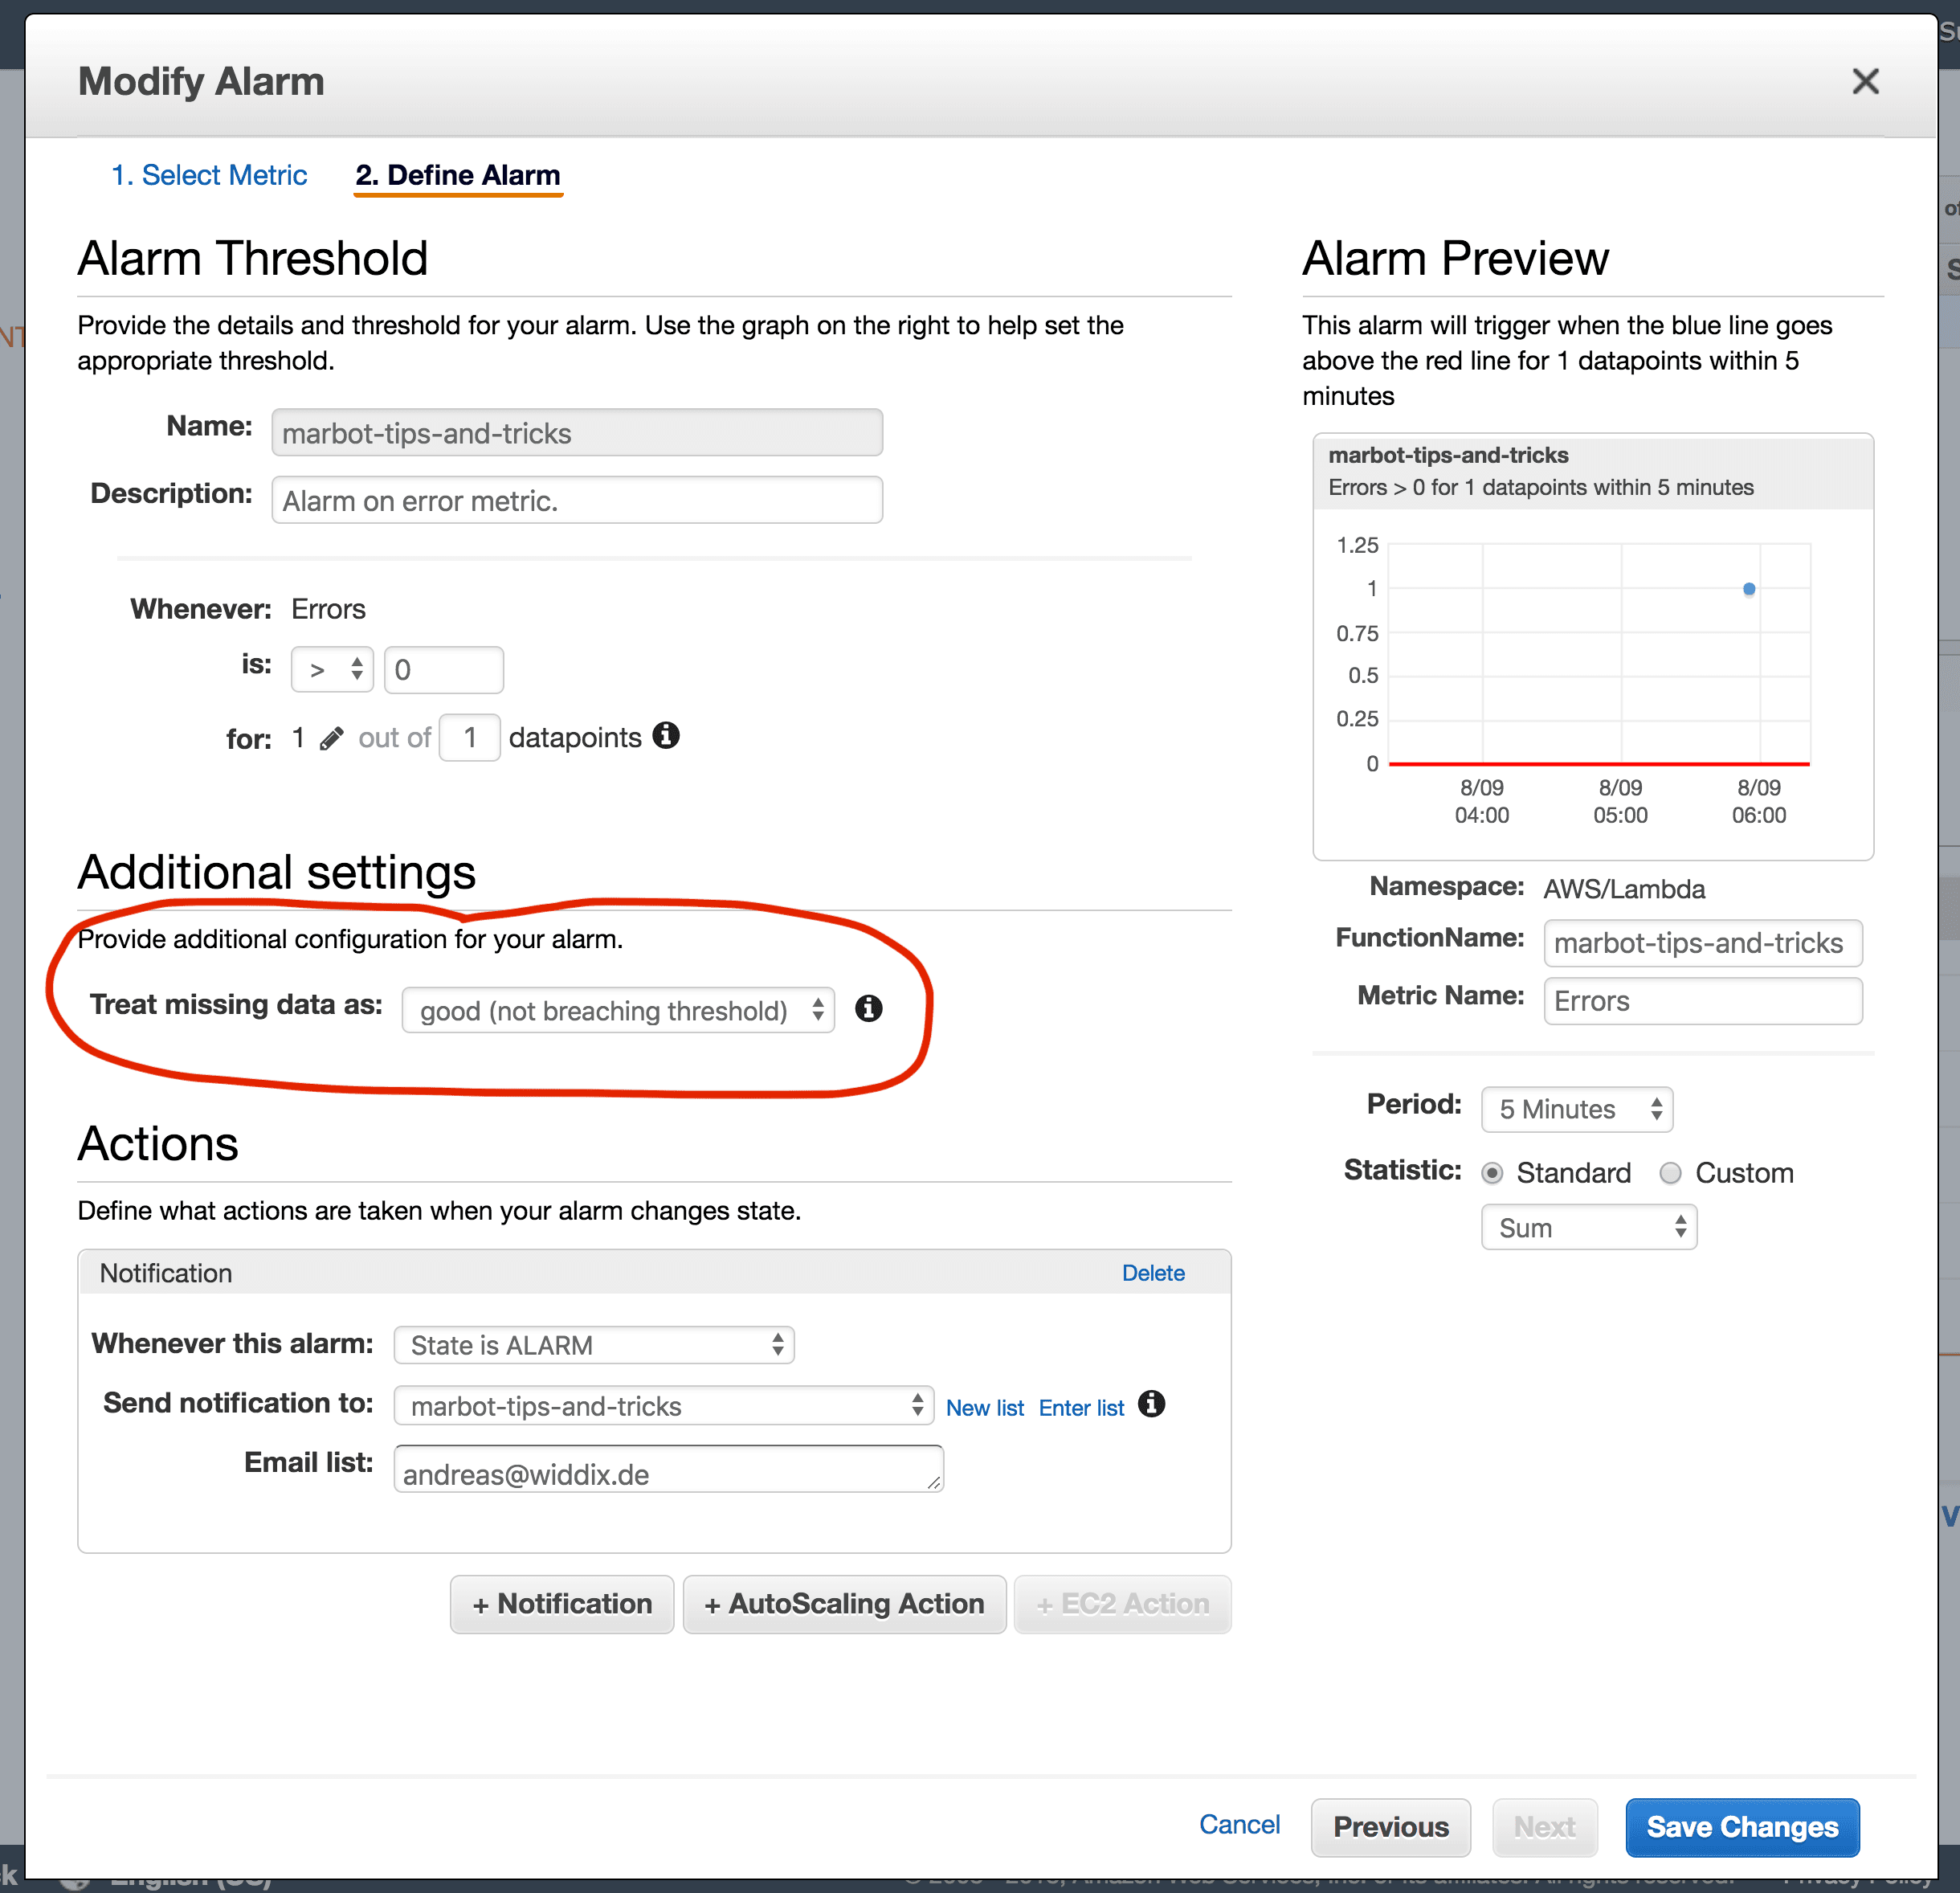
By modifying your CloudWatch alarm a little bit: change how the alarm treats missing data by selecting good (not breaching threshold) as shown in the following figure.
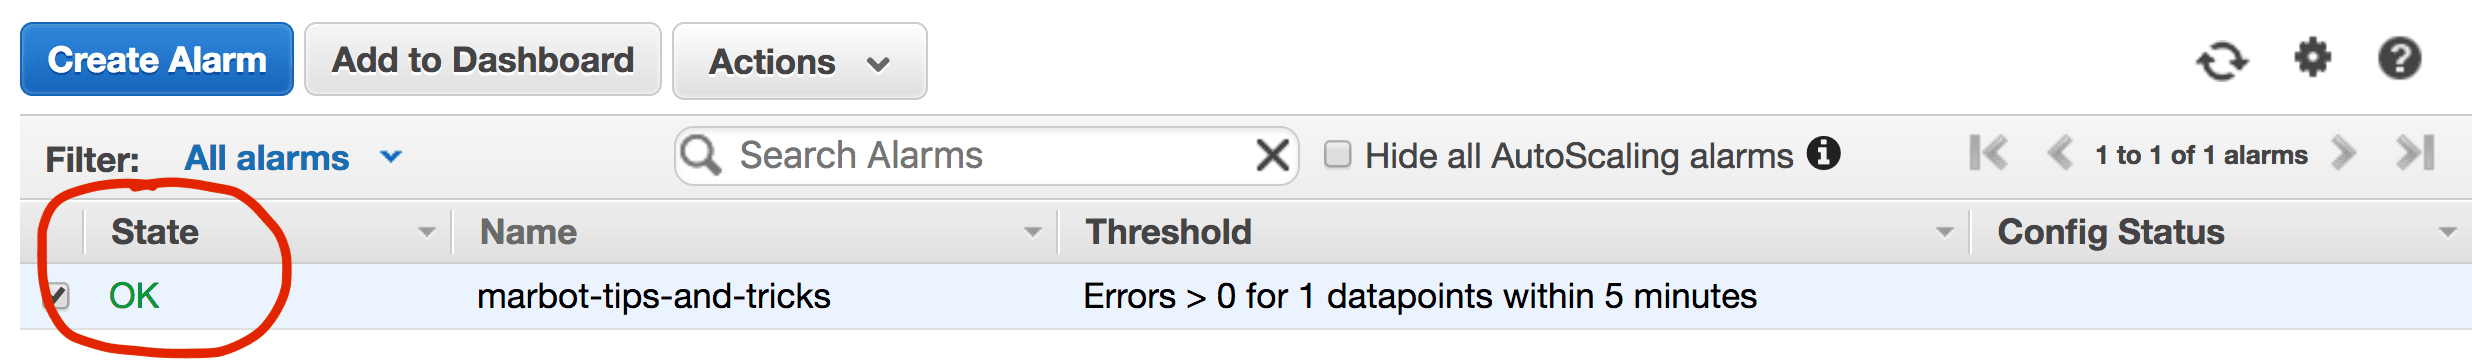
Your alarm changes to state OK immediately.
The same is true for all metrics which are counting errors. A few examples:
ThrottlesofAWS/Lambda5XXErrorofAWS/ApiGatewayHTTPCode_ELB_5XX_CountofAWS/ApplicationELBHTTPCode_Target_5XX_CountofAWS/ApplicationELBHTTPCode_Backend_5XXofAWS/ELB- …
On top of that, if you are doing Infrastructure as Code, you can also use CloudFormation to create an alarm for an error counting metric. The following code snippet contains an example.
CloudWatchAlarm: |
Stay tuned for the next post in our CloudWatch Tips and Tricks series. Don’t forget to subscribe to the blog’s RSS feed.
Take your AWS monitoring to a new level! Chatbot for AWS Monitoring: Configure monitoring, escalate alerts, solve incidents.

Andreas Wittig
Consultant focusing on Amazon Web Services (AWS). Entrepreneur building marbot.io. Author of Amazon Web Services in Action, Rapid Docker on AWS, and cloudonaut.io.
You can contact me via Email, Twitter, and LinkedIn.
Published on